• Link to Facebook
  • Link to X
  • Link to Instagram
  • Link to Youtube
  • Link to LinkedIn
  • Link to Mail
Free PDF: The 15-Minute Swing Trader's Checklist, the daily routine of a trader since 2007
Synapse Trading
  • Mentoring
    • Trading Mastery Program
    • All mentoring options
  • Signals
    • Daily trading signals
    • Signals trade log
  • Results
    • Student results and testimonials
    • Public trade log, losses left in
  • Free guides
    • Start here
    • Trading foundations
    • Technical analysis
    • Strategies and systems
    • Risk and money
    • Trading psychology
    • Markets and products
    • Free trading guides
    • Tools and resources
    • Blog
  • About
    • My background
    • My trading journey
    • Media and interviews
    • Travel log
  • Contact
    • Contact me
    • Partnerships
  • Start free
  • Click to open the search input field Click to open the search input field Search
  • Menu Menu
Spencer Li

The Random Walk Myth: Theory vs. Practice

Trading Strategies & Systems
The random walk myth - market theory

The random walk theory, which started off from academic offshoots, put forth the idea that one should give up trying to predict or beat the markets because it was impossible to do so. In theory, this theory sounds plausible, but in practice, financial history has proven otherwise, with both investors and traders consistently beating the markets.

 

The Random Walk Myth: Theory vs. Practice

The Random Walk Myth: Theory vs. Practice


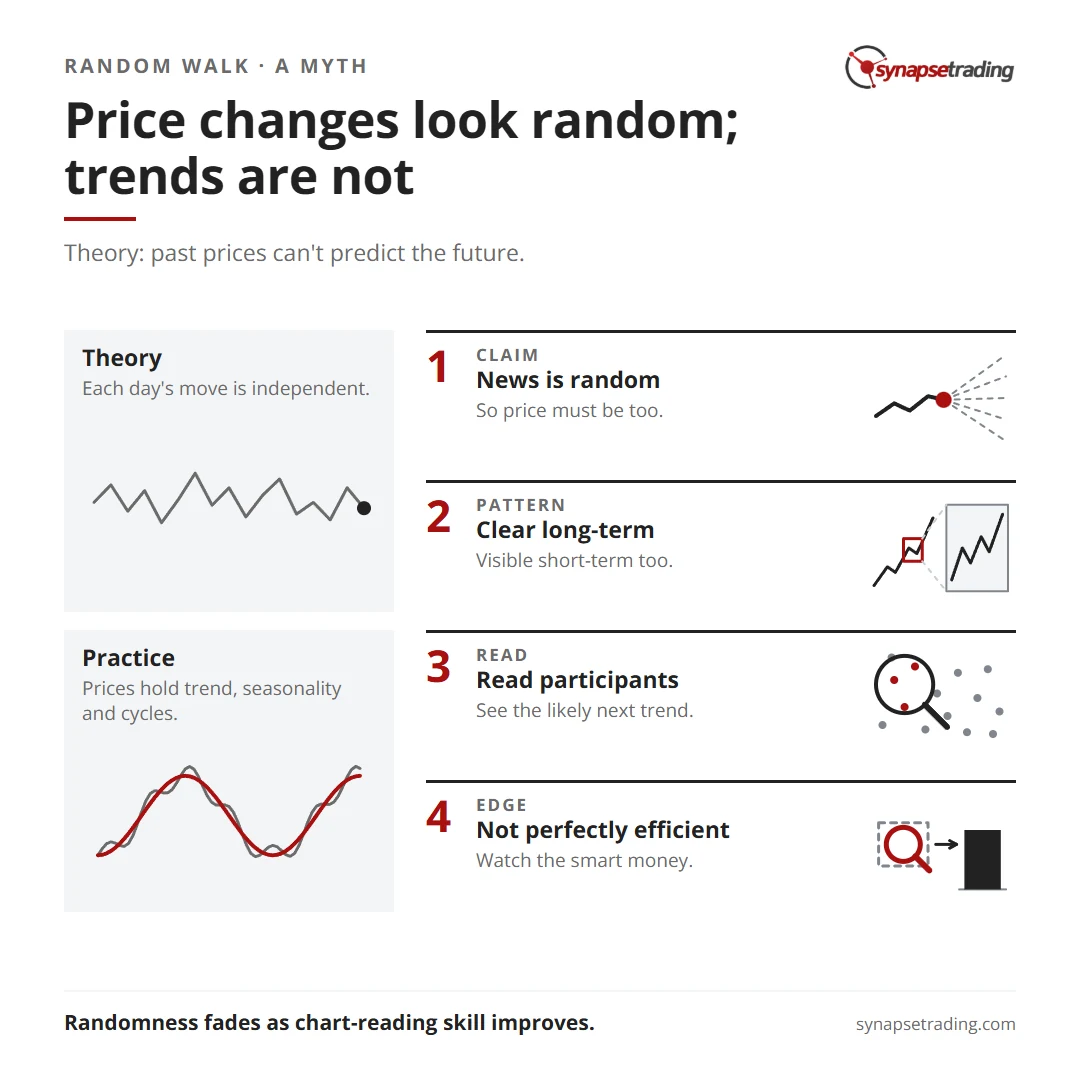
The random walk  theory states that price history is not a reliable indicator of future price direction because price changes are “serially independent”. In other words, there is no definable relationship between the direction of price movement from one day to the next. This does not mean that prices meander aimlessly or irrationally, but it means that prices have no patterns of order within the chaos.

We know that prices are determined by a balance between supply and demand. Random walk theory asserts that prices reach that equilibrium level in an unpredictable manner, moving in an irregular response to the latest information or news release. New information, being unpredictable in content, timing and importance, is therefore random in nature. Consequently, the theory puts forth that price changes themselves are random.
Price changes look random; trends are not. Summary card for the post: The Random Walk Myth: Theory vs. Practice.

Try this interesting optical illusion:

The Random Walk Myth - Can you see the pattern here amid the "randomness"?

The Random Walk Myth – Can you see the pattern here amid the “randomness”?

While price changes might seem random in nature, the trend of prices themselves are not. In reality, price movements contain well-known components of trend, seasonality and cycles which are not random in nature. Although these are mostly clear when prices are considered over the long-term, if one observes prices very closely in the short-run, price trends or patterns are also readily recognisable.

Technical analysis and chart-reading analyses the impact and action of market participants in response to the latest news or information. As a result, it is possible to understand what the different market participants are doing, and which way the market is likely to trend next. Besides, the market is not perfectly efficient, and reading the actions of the smart money will often alert traders to what is happening in the markets.


“The illusion of randomness gradually disappears as the skill in chart reading improves.” – John Murphy
by Spencer Li
https://synapsetrading.com/wp-content/uploads/2026/10/the-random-walk-myth-theory-vs-practice-card.webp 630 1200 Spencer Li https://synapsetrading.com/wp-content/uploads/2026/10/synapse-logo-horizontal-light.png Spencer Li2010-03-01 01:20:502026-08-31 10:39:04The Random Walk Myth: Theory vs. Practice
Spencer Li

Volume Spread Analysis – Spotting the Hidden Clues in Volume

Trading Strategies & Systems
Hidden clues in volume - technical analysis

Price action and volume lies at the core of technical analysis, since that is all the data a market technician works with. Almost all technical methods, such as chart patterns, candlestick patterns or even Elliot wave are studies of price action. Indicators like RSI, Stochastics or MACD are all calculated from price data as well. To understand the big picture, it pays to first understand the building blocks.

Volume Spread Analysis - Spotting the Hidden Clues in Volume

Volume Spread Analysis – Spotting the Hidden Clues in Volume

At the most basic level, price action is the movement of a security’s price. This encompasses all technical and classical pattern analysis, including swings, support and resistance, trends, etc. The most commonly known tools are candlestick and price bar patterns, which are ways of cataloging common price action patterns.

However, the crux about price action is not about memorising patterns and names. It is about understanding. That is what professional traders do. No two people will analyze every bit of price action the same way, and that is why a lot of traders find the concept of price action so elusive. That is why it takes experience to read price action.
Read price together with volume. Summary card for the post: Volume Spread Analysis - Spotting the Hidden Clues in Volume.

Below is a useful picture summary of essential candlestick patterns:

candlesticks patterns

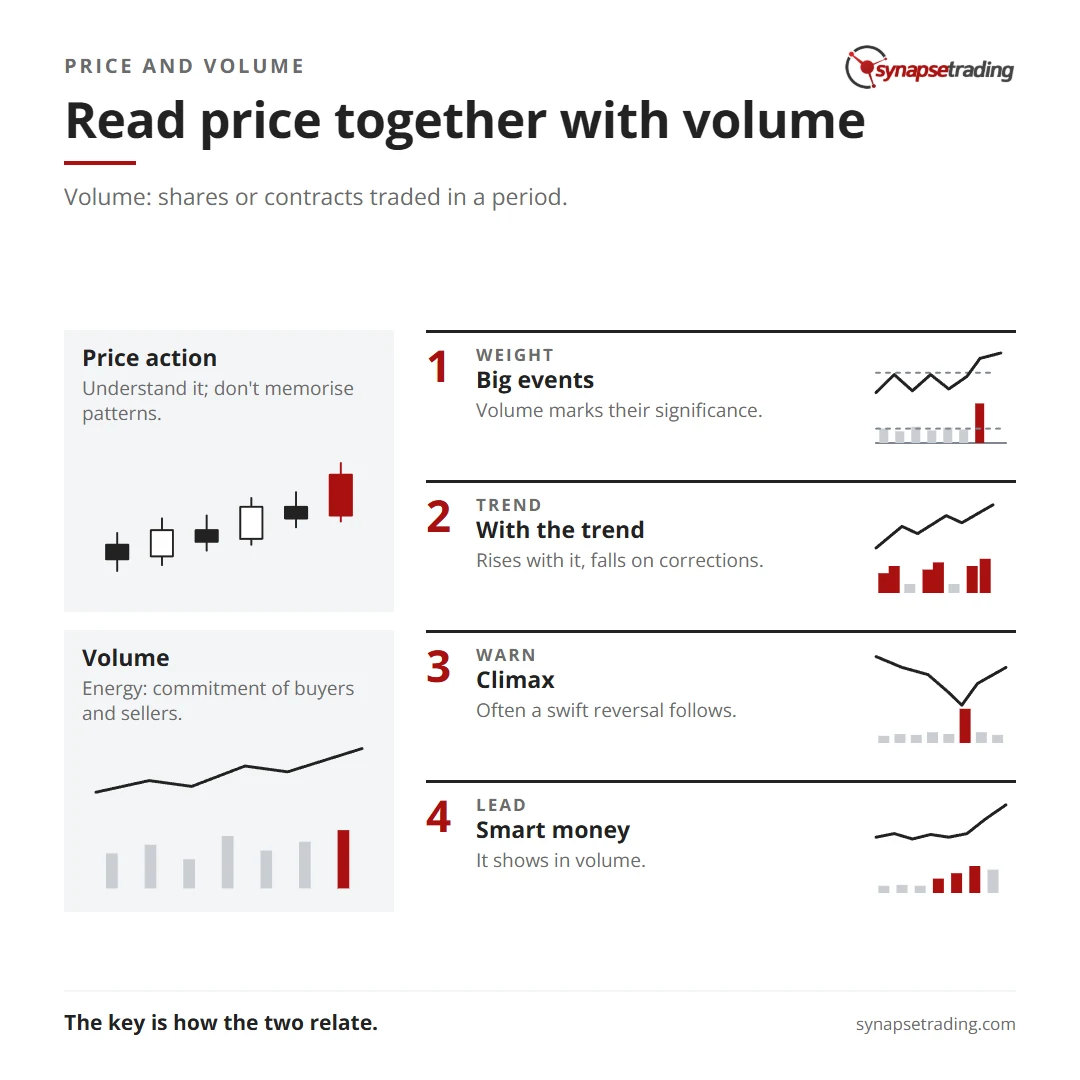
Volume is the number of shares or contracts that trade hands from sellers to buyers during a period of time, and serves as a measure of activity. If a buyer of a stock purchases 100 shares from a seller, then the volume for that period increases by 100 shares based on that transaction.

Hence, volume is energy. It represents the level of commitment and participation by buyers and sellers, hence it indirectly indicates the supply/demand equation. Volume at times also serves as a leading indicator, because large movements in the market are due to the actions of market-movers (also known as the professionals or smart money), and these actions will show up in volume and price. At times,either of these two could provide the leading clues to future market movement.

The level of volume marks the significance of events – for example a breakout, a gap movement, or breaking a key support, etc. The higher the volume, the more significant these events are, because it shows more participation by smart money. In general, volume should be rising n the direction of the trend and decreasing on corrections, which would also be useful for identifying pullbacks in a trend. Watch out for unusual climatic moves in volume, for a climax usually results in a swift reversal or rebound.

The key is understanding the relationship between price and volume.

by Spencer Li
https://synapsetrading.com/wp-content/uploads/2026/10/the-importance-of-price-action-card.webp 630 1200 Spencer Li https://synapsetrading.com/wp-content/uploads/2026/10/synapse-logo-horizontal-light.png Spencer Li2010-01-10 01:30:512026-09-03 21:04:39Volume Spread Analysis – Spotting the Hidden Clues in Volume
Page 12 of 12«‹101112

Free checklist

The 15-Minute Swing Trader’s Checklist

The daily and weekly routine I use to find, manage and review trades in about 15 minutes a day, trading since 2007.

Get the free checklist

Topics

  • Trading foundations
  • Technical analysis
  • Strategies and systems
  • Risk and money
  • Trading psychology
  • Markets and products

Synapse Trading

Swing trading for busy professionals, in 15 minutes a day.

Start free

Learn

  • Start here
  • Free trading guides
  • Blog
  • Tools and resources

Programs

  • Trading Mastery Program
  • Daily trading signals
  • Student results
  • Public trade log

Company

  • About
  • Contact me
  • Partnerships
  • Disclaimer
  • Privacy policy
  • Terms & Conditions

Synapse Trading Pte Ltd
Registration No. 201316168H
WhatsApp +65-8897-1204
info@synapsetrading.com

Contact Us

Synapse Trading Pte Ltd
Registration No. 201316168H

Whatsapp: +65-8897-1204
Telegram: @iamrecneps
Email: info@synapsetrading.com

Links

Disclaimer
Privacy policy
Terms & Conditions
Contact us
Partnerships

© 2012-2026 Synapse Trading | All rights reserved. Educational content only, not personalised financial advice. Trading carries risk, including loss of capital. Past performance is not indicative of future results. Synapse Trading is not licensed or regulated by MAS.
  • Link to Facebook
  • Link to X
  • Link to Instagram
  • Link to Youtube
  • Link to LinkedIn
  • Link to Mail
Scroll to top Scroll to top Scroll to top