• Link to Facebook
  • Link to X
  • Link to Instagram
  • Link to Youtube
  • Link to LinkedIn
  • Link to Mail
Free PDF: The 15-Minute Swing Trader's Checklist, the daily routine of a trader since 2007
Synapse Trading
  • Mentoring
    • Trading Mastery Program
    • All mentoring options
  • Signals
    • Daily trading signals
    • Signals trade log
  • Results
    • Student results and testimonials
    • Public trade log, losses left in
  • Free guides
    • Start here
    • Trading foundations
    • Technical analysis
    • Strategies and systems
    • Risk and money
    • Trading psychology
    • Markets and products
    • Free trading guides
    • Tools and resources
    • Blog
  • About
    • My background
    • My trading journey
    • Media and interviews
    • Travel log
  • Contact
    • Contact me
    • Partnerships
  • Start free
  • Click to open the search input field Click to open the search input field Search
  • Menu Menu
Spencer Li

Techniques for Identifying Market Trends

Trading Strategies & Systems
How to spot a trend - technical analysis

If you want to make money by timing the stock market you need to follow the trends.

Buying and selling creates its own momentum and a market that’s moving up or down is likely to keep moving in that direction for a certain period of time.
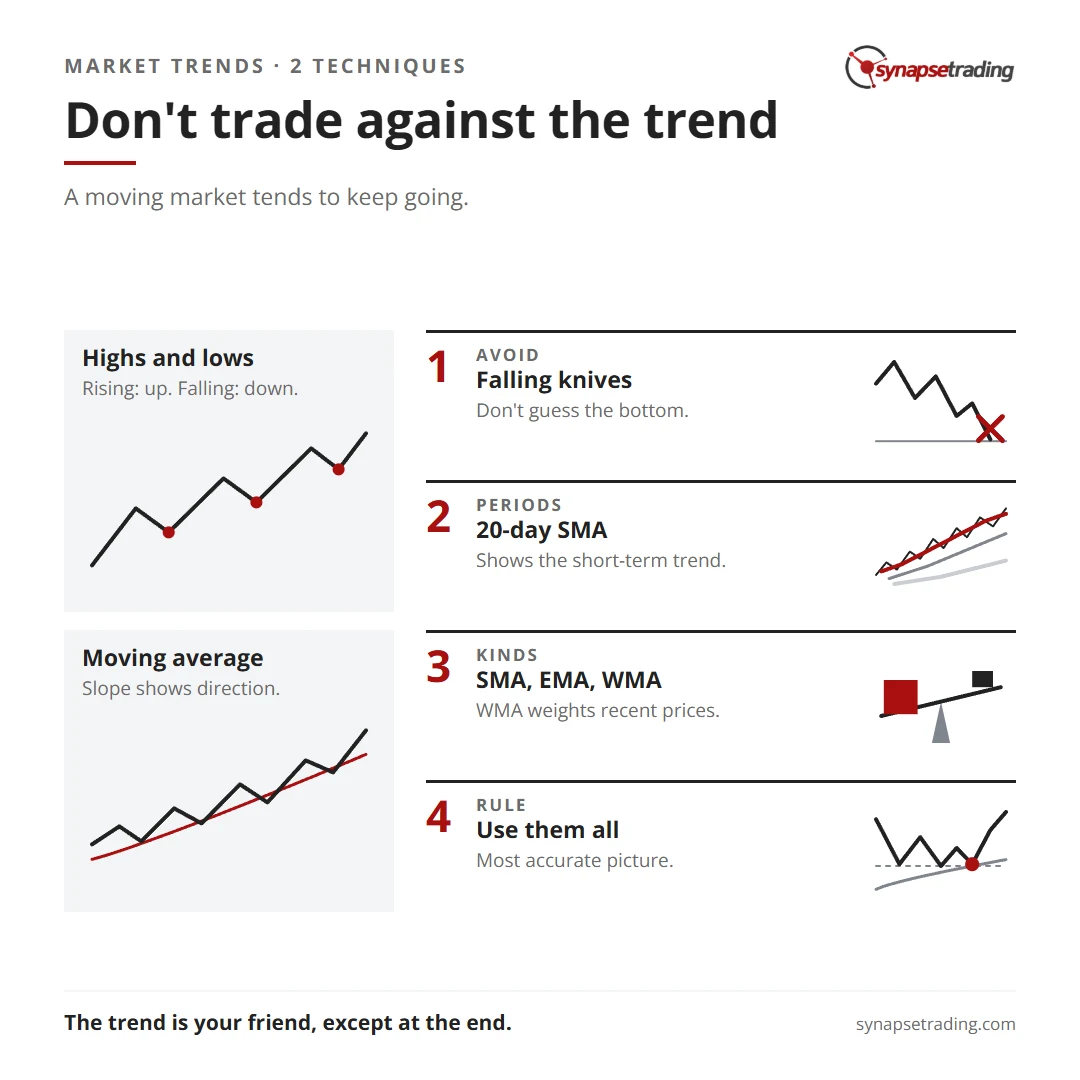
Don't trade against the trend. Summary card for the post: Techniques for Identifying Market Trends.

What this means is that you should avoid trading against the current trend.

For example, when the market is bearish and heading down, don’t try to predict which stocks have hit bottom, that would be like trying to catch a falling knife.

Instead, find an objective way to both identify the current trend and decipher when that trend has changed too, because just like the saying goes, “the trend is your friend, except at the end”.

So, let’s explore two simple techniques for identifying market trends.

The most common ways to look at the nature of a trend’s movement. As a stock moves up or down, it rarely does so in a straight line, rather it zigzags forming a series of highs and lows.

If the highs keep getting higher and the lows keep getting higher that stock is in an uptrend. If the highs get lower and the lows get lower, you’re looking at a downtrend. And if the highs and lows are consistent over a certain period, it’s in a sideways trend.

Another way to identify the market trend is to look beyond the daily price fluctuations and determine the general direction of a stock.

You do this by calculating an average. For example, a 20-day simple moving average or an SMA, is an average of the past 20 days of closing prices, which moves or updates on a daily basis by incorporating the latest prices.

If the SMA is sloping upwards, that’s an uptrend; sloping down downtrend and sideways, means flat.

A 20-day SMA gives a good picture of the short-term trend but you can also use other periods like the 50-day SMA and the 200-day SMA for the long-term trend. Those aren’t the only moving averages, however, there’s the exponential moving average or EMA, and the weighted moving average or WMA, which gives more weight to recent prices.

As a trader, you can use any of these techniques individually, but for the most accurate picture of market trends, you should use them all.

Because when it comes to behavioral analysis, the best way to increase your chances of success, is to consider as much data as possible.

So that’s market timing! Next, let’s cover support and resistance zones.
by Spencer Li
https://synapsetrading.com/wp-content/uploads/2026/10/free-video-tutorials-behavioral-analysis-market-timing-4b-identifying-market-trends-card.webp 630 1200 Spencer Li https://synapsetrading.com/wp-content/uploads/2026/10/synapse-logo-horizontal-light.png Spencer Li2015-05-22 08:00:242026-10-14 09:37:37Techniques for Identifying Market Trends
Spencer Li

The Basics of Market Timing

Trading Strategies & Systems
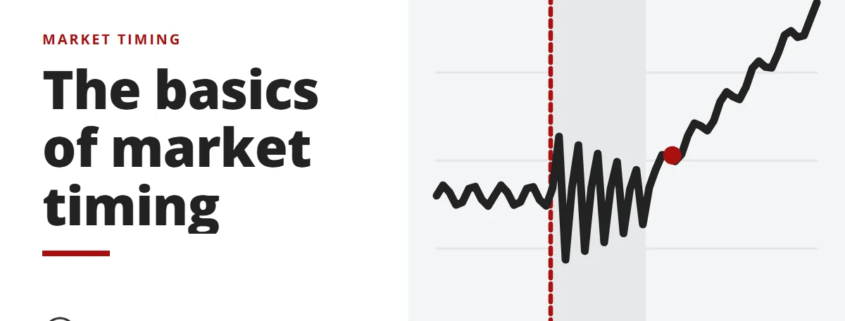
The basics of market timing - market timing

The price of every stock or financial product fluctuates over time, and no matter how strong a stock is or how solid its fundamentals, you can only make money when the stock goes up in price relative to where you bought it. That’s why it’s so important to read the market accurately and buy stocks at the right time.

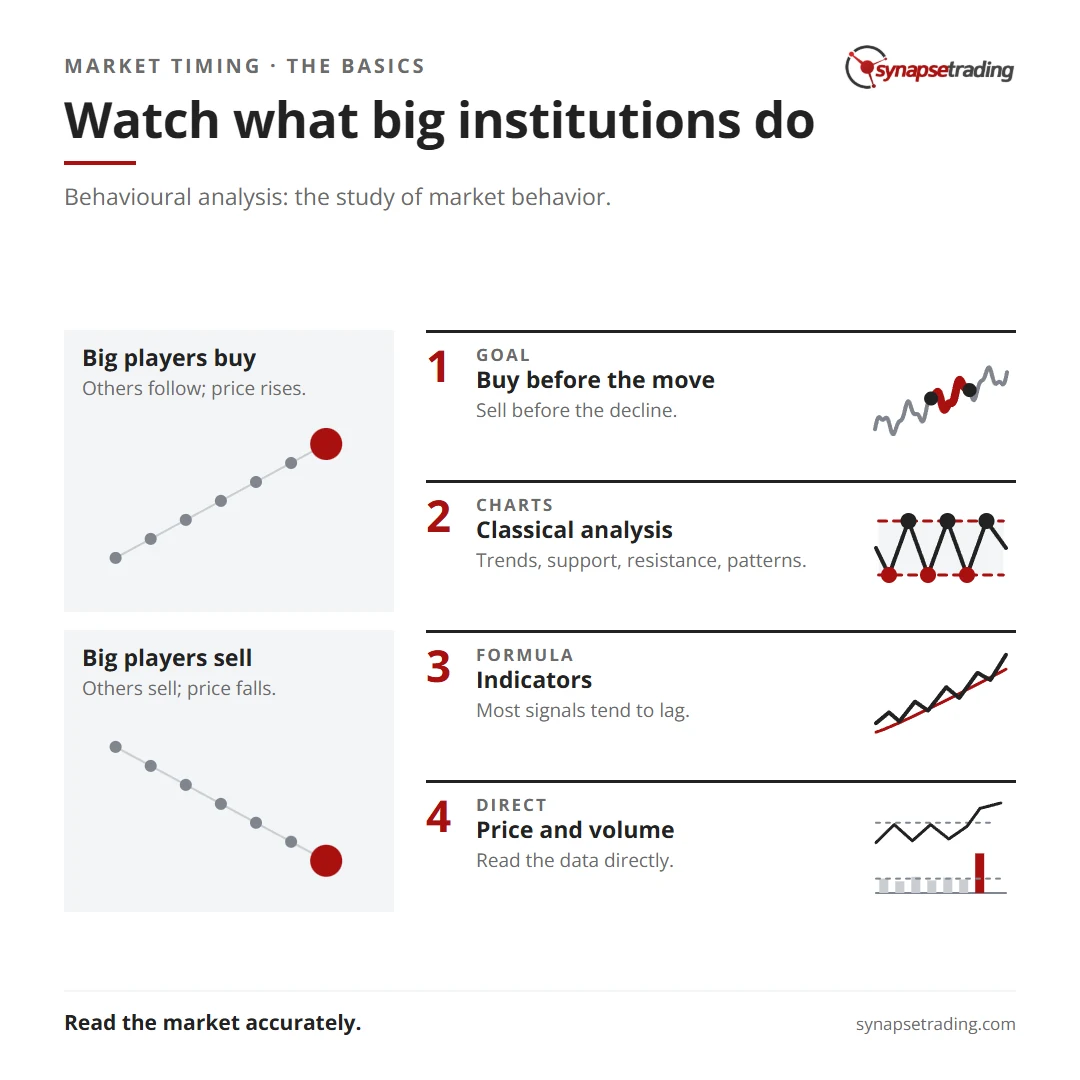
Watch what big institutions do. Summary card for the post: The Basics of Market Timing.

The goal for any investor is to buy a stock just before it makes a big move, and sell it just before it starts to decline. The question is how do you do it?

For starters, you want to look at the big players on the financial landscape, like banks and financial institutions.

These are the organizations who determine the direction of a stock more than any other. If they start to buy a certain stock in large numbers, chances are other investors will follow suit, leading to a rise in value. And if they start to dump a stock, then other shareholders will likely do the same, causing a decrease in value.

By keeping a close eye on what these institutions are doing, you’ll be able to spot shifts in the market before they happen.

This study of market behavior is known as behavioural analysis and encompasses three main schools of thought: classical technical analysis, indicator-based technical analysis, and price action and volume analysis.

Classical technical analysis is all about reading charts. The goal is to identify the trend lines of a particular stock and pinpoint the support and resistance zones, where buying and selling usually takes place.

Classical technical analysis also includes pattern recognition techniques, used to identify shapes on the chart which have a certain predictive value.

Then, there’s indicator based technical analysis in which you take price and volume data and plug it into a mathematical formula to figure out when to buy or sell. Unfortunately, most indicator signals tend to be lagging, which can result in misleading or inaccurate analysis.

Finally, there’s price action and volume analysis, in which a trader leverages their deep understanding of market movements to interpret price and volume data directly. It’s the methodology that most professional traders use as it allows faster, more accurate predictions.

Those are the basics.

Over the next few videos, we’ll dive a little deeper and teach you how to identify market trends and most importantly how to pinpoint the right time to buy and sell.

by Spencer Li
https://synapsetrading.com/wp-content/uploads/2026/10/free-video-tutorials-behavioral-analysis-market-timing-4a-the-basics-of-market-timing-card.webp 630 1200 Spencer Li https://synapsetrading.com/wp-content/uploads/2026/10/synapse-logo-horizontal-light.png Spencer Li2015-05-15 08:00:232026-09-10 14:07:54The Basics of Market Timing
Spencer Li

What Really Moves the Financial Markets?

Trading Strategies & Systems
What really moves markets? - macro

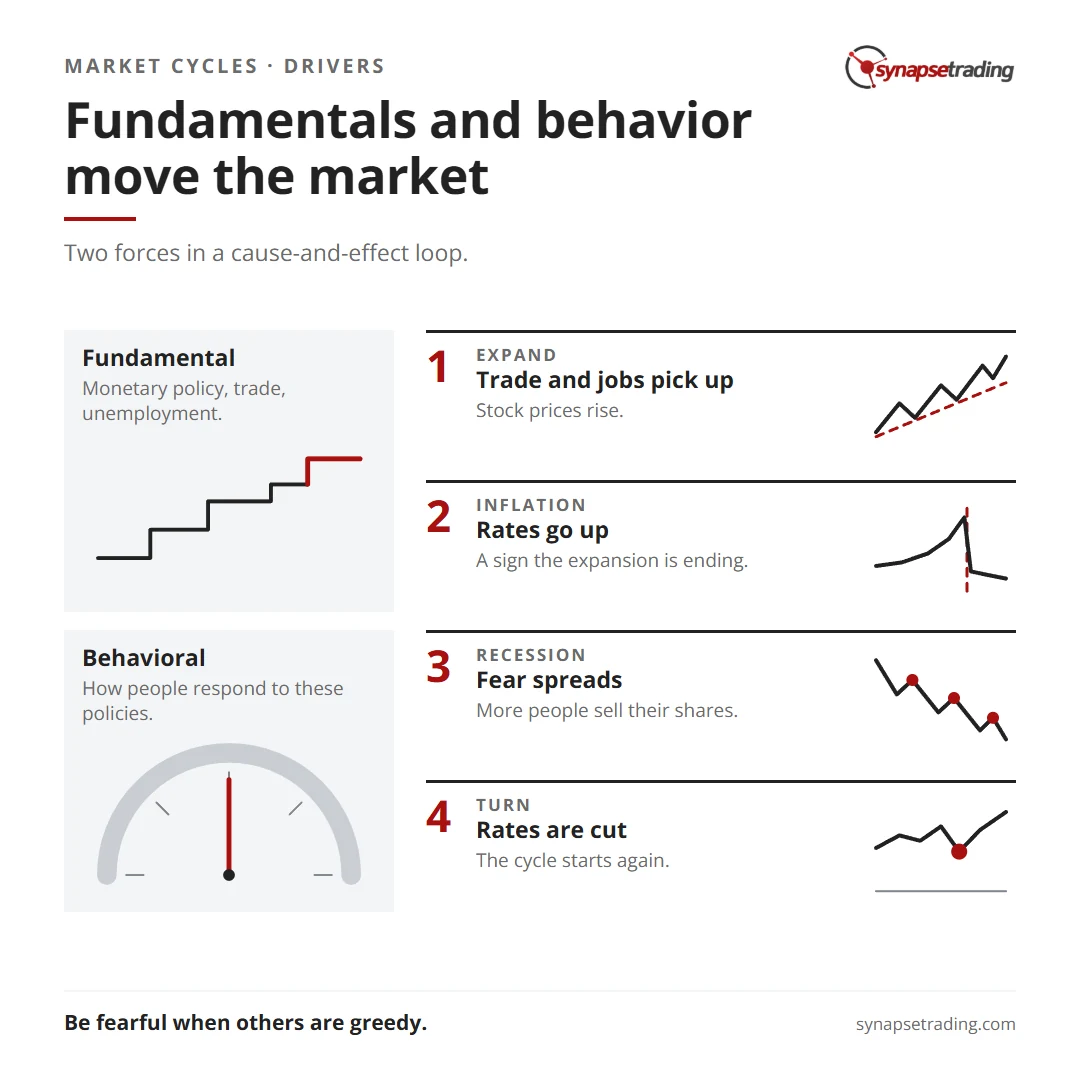
We’ve seen how the markets move in cycles but what are the factors that govern those movements? It’s many things but they can be grouped into two main categories: fundamental factors like monetary, policy, balance of trade and unemployment, and behavioral forces like how people respond to these policies. These two factors are always playing off each other in a series of actions and reactions like a cause and effect loop.

Fundamentals and behavior move the market. Summary card for the post: What Really Moves the Financial Markets?.

Now, as an investor, the key is to focus on the sequence of events in the business cycle and identify clues to determine what’s coming next. In general, the market goes through two phases: expansion which is generally good and contraction which is generally bad.

During the early stages of expansion, the recovery is driven primarily by fundamental factors as economies expand, and trade and employment picks up. Central banks usually tighten their policies to keep inflation down which is good for stocks and bonds, but not so good for commodities. These fundamentals lead to a rise in stock prices which only encourage more people to jump into the market. It’s good at first but as this greed and exuberance spreads, stock prices eventually outpace their actual value.

This leads to inflation, which is marked by an increase in commodity prices to counteract these behavioral forces. Central banks usually step in and increase interest rates, which help curb the money supply and decrease inflation. This action signals that the expansion is ending and stocks will soon be on the decline, but it also means that commodity related products will be going up. If you’re aware of these signals, you’ll know that this is a good time to switch from stocks to commodities.

Then during the recession that follows, behavioral forces will become stronger than ever, as more people realize that the stock market is declining. Fear and panic will spread, forcing even more to sell off their shares during these periods savvy investors will reduce their stock portfolios and wait for the market to turn around which they will because eventually central banks will step in and cut interest rates to increase the money supply. These fundamental drivers will lead to a rise in stock prices making it the perfect time to jump back in the market and that starts the cycle all over again.

Now as an investor, it’s important to recognize these signals and never lose sight of the bigger picture. It’s like Warren Buffett once said, be fearful when others are greedy and greedy when others are fearful. So, keep an eye on the fundamental and behavioral factors that move the market and always stay one step ahead of the game.

by Spencer Li
https://synapsetrading.com/wp-content/uploads/2026/10/free-video-tutorials-riding-big-market-cycles-2b-moves-markets-card.webp 630 1200 Spencer Li https://synapsetrading.com/wp-content/uploads/2026/10/synapse-logo-horizontal-light.png Spencer Li2014-11-10 08:45:432026-09-04 15:25:27What Really Moves the Financial Markets?
Spencer Li

How to Ride the Big Business & Market Cycles

Trading Strategies & Systems
Riding the big market cycles - macro

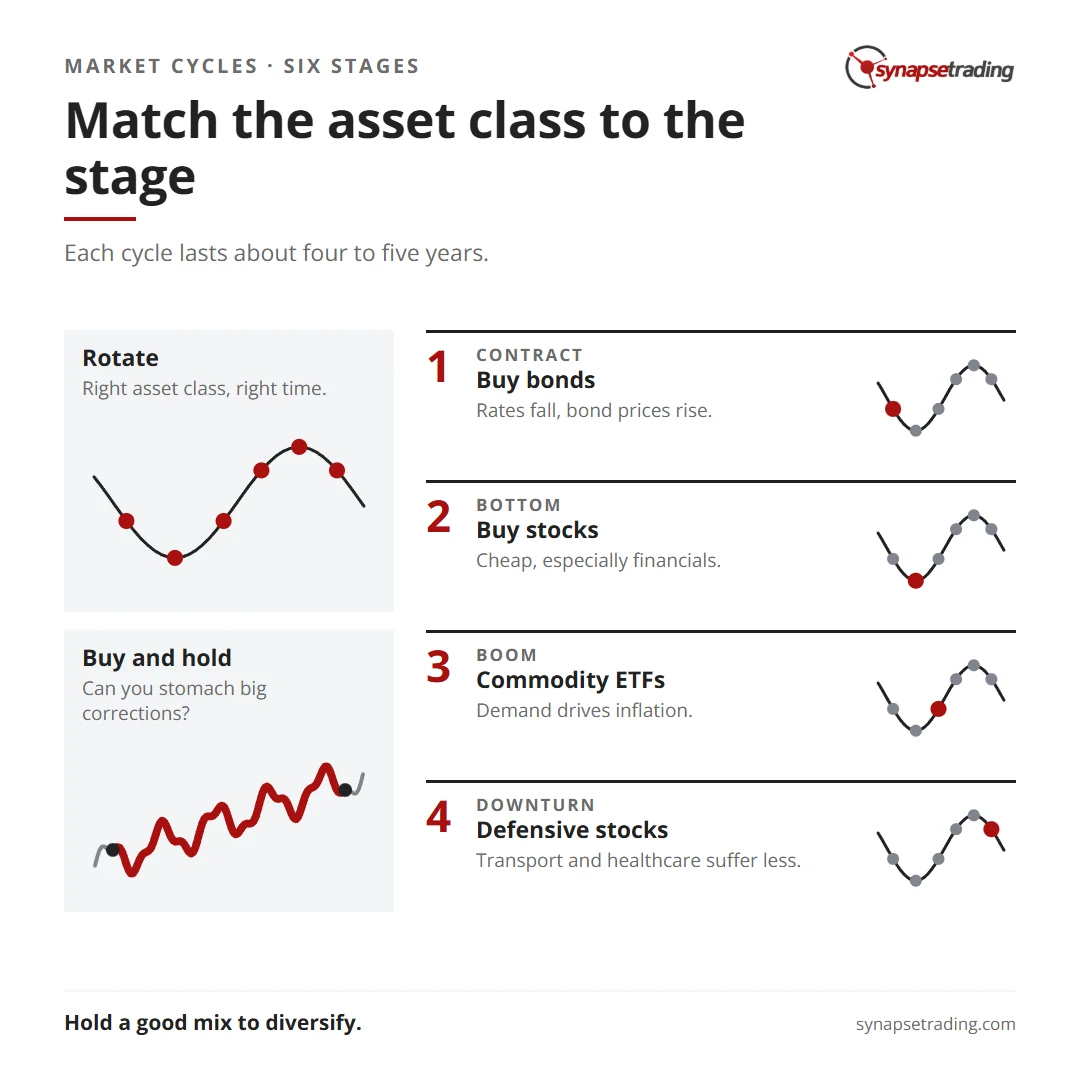
Just like the seasons, financial markets go through cycles and by applying basic economic principles and portfolio strategies, you can capitalize on these big market movements to either ride the wave or weather the storm. In general, each market cycle lasts about four to five years, and within each cycle are usually six stages.

Match the asset class to the stage. Summary card for the post: How to Ride the Big Business & Market Cycles.

During each stage, certain asset classes outperform others. That’s why it’s important to buy the right asset class at the right time and to always hold a good mix which diversifies your risk. So what are the six stages of the market cycle and what should you do in each?

Let’s start with stage one which begins with the market contracting. This is a good time to buy bonds as central banks will lower interest rates and expand the money supply to improve the economy, thus boosting bond prices.

During the second stage as the market hits bottom, you’ll want to buy more stocks especially in financials. You can buy them cheap and hold on to them as the market turns around as it did from 2003 to 2007.

As the bull market progresses into stage three and the economy kicks into full gear, there will be an increased demand for raw materials, which will lead to inflation, making it a good time to buy inflation sensitive products such as commodity tracking ETFs.

Then, during the fourth stage as the bull market reaches the late stage you’ll want to reduce your bond holdings as they’ll be peaking.

In the fifth stage as the market hits its ceiling and stock prices are maxing out. You should look to reduce your stock holdings in favor of more commodity ETFs. For example, when the stock market declined in late 2007, stocks dropped significantly but commodities continued to climb meaning if you had swapped stocks for commodities when the market was peaking, you would have avoided losses and made a profit even as the stock market weakened.

And finally, there’s the sixth stage of the cycle when the economy contracts and all asset classes begin to decline. This is a good time to acquire defensive stocks like public transportation and healthcare companies which are less affected during downturns.

Of course, if you’re a long-term stock investor, you may not need to switch around asset classes as long as you’re able to stomach the big market corrections. You can take the buy and hold approach instead and accumulate fundamentally strong stocks and profit during stages three and four as the market expands.

So those are the basic principles of market cycles. Next, we’ll dig deeper and figure out what causes the market to move in the first place.

by Spencer Li
https://synapsetrading.com/wp-content/uploads/2026/10/free-video-tutorials-riding-the-big-market-cycles-2a-business-market-cycles-card.webp 630 1200 Spencer Li https://synapsetrading.com/wp-content/uploads/2026/10/synapse-logo-horizontal-light.png Spencer Li2014-11-07 08:45:372026-09-29 19:14:32How to Ride the Big Business & Market Cycles
Spencer Li

The Basic Principles of Trading & Investing

Trading Strategies & Systems
Trading and investing basics - trading basics

When you work a job, you’re basically exchanging time for money: the more hours you work, the more money you make. It’s a good way to get by but a bad way to build wealth, because eventually you simply run out of hours.

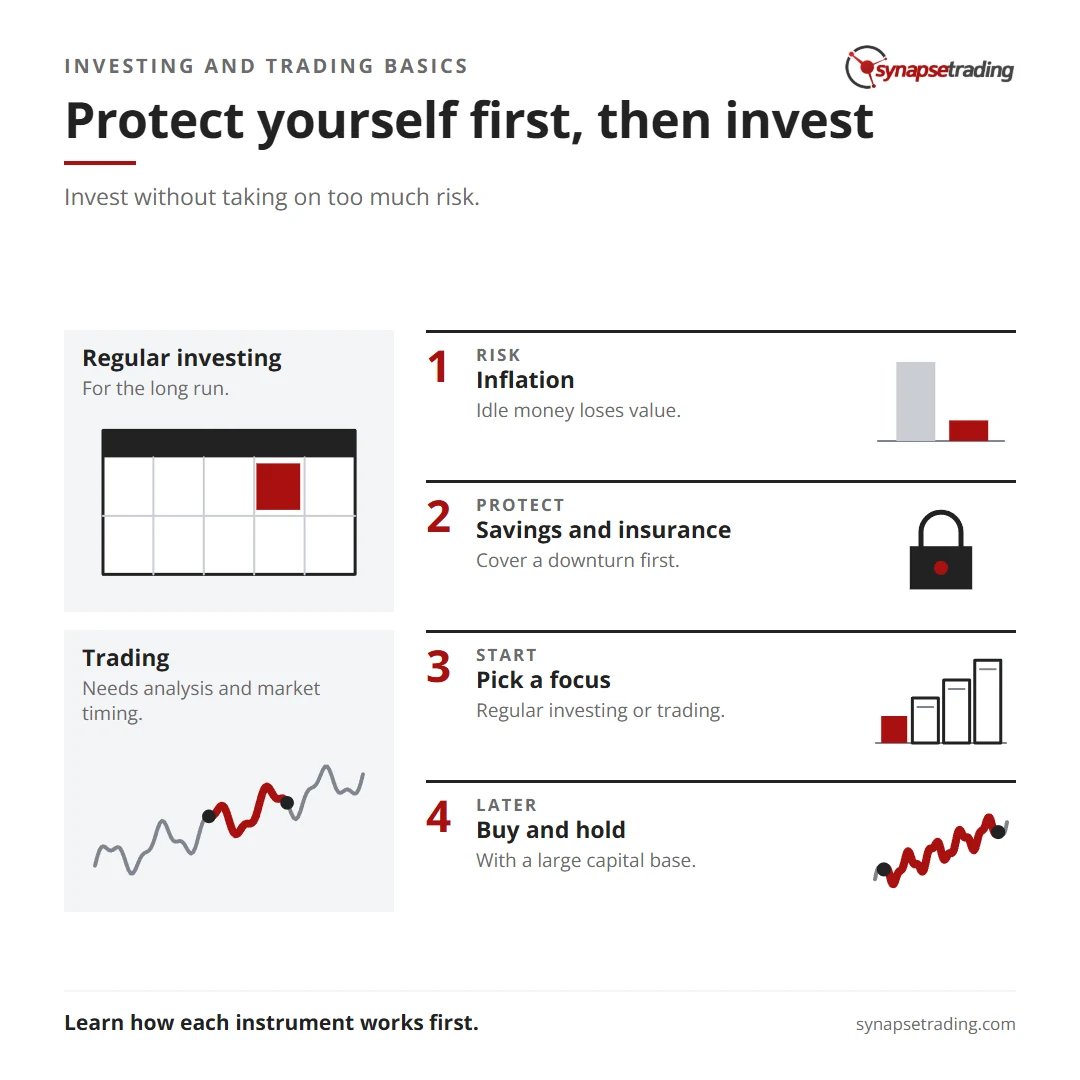
Protect yourself first, then invest. Summary card for the post: The Basic Principles of Trading & Investing.

That’s why if you want to grow wealth quickly, you need to make your money work for you. How? By investing and trading in the financial markets. Okay, so think of the financial markets as a garden where you grow well, just like you plant a seed and watch it grow.

In the financial markets, you can invest a small amount in companies, real estate, foreign currencies, and other securities, then share in their profits as they grow in value, and thanks to a financial principle called compound interest, your take becomes bigger and bigger every year. For instance, let’s say you invest $1,000 in Company A.

In the first year, they grow 15%, meaning you make 150 dollars, bringing your total to $1,150. Then the next year, they grow another 15%. But instead of making 15% on $1,000, you make 15% on your new total $1,150 which translates into $172.50 for the year, and $1,322.50 total.

Do this a couple more years and you will have doubled your money without lifting a finger, but if you never invested that $1,000 you wouldn’t have earned anything.

In fact, your money would have decreased in value due to the rising cost of living or inflation, even with an inflation rate of 5%, that $1000 would have lost a third of its value in ten years. So, clearly investing is the better way to go but how do you do it without taking on too much risk?

First off, you should put enough money into savings and insurance to protect yourself in the event of a downturn or adversity.

Second, if you’re just starting out, you can focus on regular investing or trading.

Regular investing allows you to accumulate wealth in the long run, while trading enables you to capture consistent short-term gains to grow your capital quickly, provided you understand behavioral analysis and market timing.

Finally, once you’ve established a large capital base, you can choose to buy and hold for the long term to generate capital gains and passive income, or use long term trading strategies to manage your portfolio effectively but those are just the basics.

There are many instruments for trading and investing, and in order to grow wealth on the market, you’ll need to understand how they work.

So next, let’s take a closer look at one of the most common types of investments: stocks.

by Spencer Li
https://synapsetrading.com/wp-content/uploads/2026/10/free-video-tutorials-basics-trading-investing-1a-market-basics-card.webp 630 1200 Spencer Li https://synapsetrading.com/wp-content/uploads/2026/10/synapse-logo-horizontal-light.png Spencer Li2014-09-25 10:25:172026-09-07 15:29:49The Basic Principles of Trading & Investing
Page 10 of 12«‹89101112›»

Free checklist

The 15-Minute Swing Trader’s Checklist

The daily and weekly routine I use to find, manage and review trades in about 15 minutes a day, trading since 2007.

Get the free checklist

Topics

  • Trading foundations
  • Technical analysis
  • Strategies and systems
  • Risk and money
  • Trading psychology
  • Markets and products

Synapse Trading

Swing trading for busy professionals, in 15 minutes a day.

Start free

Learn

  • Start here
  • Free trading guides
  • Blog
  • Tools and resources

Programs

  • Trading Mastery Program
  • Daily trading signals
  • Student results
  • Public trade log

Company

  • About
  • Contact me
  • Partnerships
  • Disclaimer
  • Privacy policy
  • Terms & Conditions

Synapse Trading Pte Ltd
Registration No. 201316168H
WhatsApp +65-8897-1204
info@synapsetrading.com

Contact Us

Synapse Trading Pte Ltd
Registration No. 201316168H

Whatsapp: +65-8897-1204
Telegram: @iamrecneps
Email: info@synapsetrading.com

Links

Disclaimer
Privacy policy
Terms & Conditions
Contact us
Partnerships

© 2012-2026 Synapse Trading | All rights reserved. Educational content only, not personalised financial advice. Trading carries risk, including loss of capital. Past performance is not indicative of future results. Synapse Trading is not licensed or regulated by MAS.
  • Link to Facebook
  • Link to X
  • Link to Instagram
  • Link to Youtube
  • Link to LinkedIn
  • Link to Mail
Scroll to top Scroll to top Scroll to top