• Link to Facebook
  • Link to X
  • Link to Instagram
  • Link to Youtube
  • Link to LinkedIn
  • Link to Mail
Free PDF: The 15-Minute Swing Trader's Checklist, the daily routine of a trader since 2007
  • Shopping Cart Shopping Cart
    0Shopping Cart
Synapse Trading
  • Mentoring
    • Trading Mastery Program
    • All mentoring options
  • Signals
    • Daily trading signals
    • Signals trade log
  • Results
    • Student results and testimonials
    • Public trade log, losses left in
  • Free guides
    • Start here
    • Trading foundations
    • Technical analysis
    • Strategies and systems
    • Risk and money
    • Trading psychology
    • Markets and products
    • Free trading guides
    • Tools and resources
    • Blog
  • About
    • My background
    • My trading journey
    • Media and interviews
    • Travel log
  • Contact
    • Contact me
    • Partnerships
  • Start free
  • Student login
  • Click to open the search input field Click to open the search input field Search
  • Menu Menu

Indicators, candlestick patterns, chart patterns and price-action method.

Technical Analysis & Price Action

Indicators, candlestick patterns, chart patterns and price-action method.

All articles, page 17

The Synapse Network

Thrusting Line Pattern

Technical Analysis & Price Action
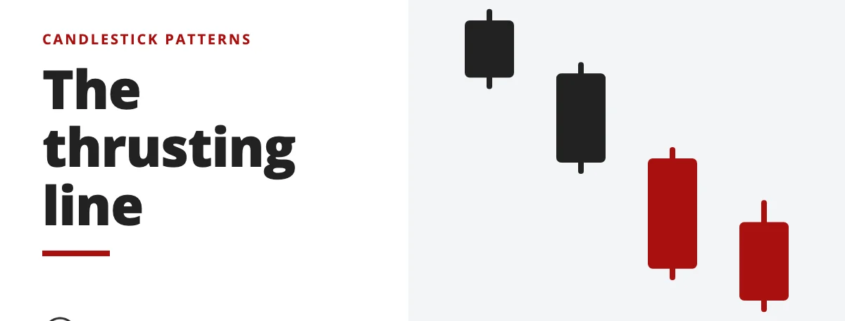
The thrusting line - candlestick patterns

A thrusting line is a two-candle pattern that usually signals a bearish continuation. See how to read the second candle's close and how traders use it.

23 Aug 2023Read the guide ›

by The Synapse Network
https://synapsetrading.com/wp-content/uploads/2026/10/thrusting-line-pattern-card.webp 630 1200 The Synapse Network https://synapsetrading.com/wp-content/uploads/2026/10/synapse-logo-horizontal-light.png The Synapse Network2023-08-23 13:22:332026-06-24 21:19:18Thrusting Line Pattern
The Synapse Network

Bullish Irikubi & Bearish Irikubi Pattern

Technical Analysis & Price Action
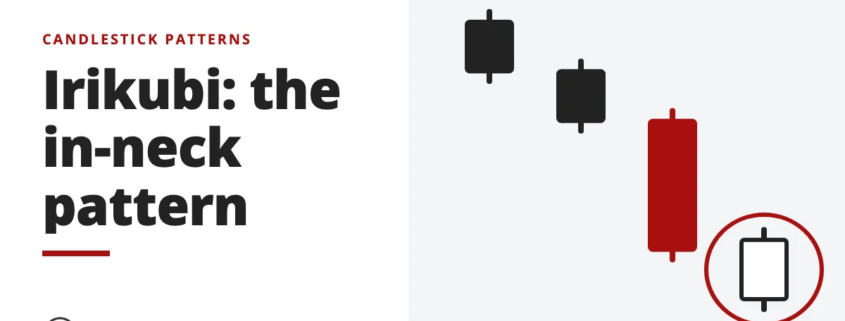
Irikubi: the in-neck pattern - candlestick patterns

An irikubi, or in neck pattern, pairs a large candle with a much smaller opposite one that closes just inside its close. See what each version signals.
19 Aug 2023Read the guide ›

by The Synapse Network
https://synapsetrading.com/wp-content/uploads/2026/10/bullish-irikubi-bearish-irikubi-pattern-card.webp 630 1200 The Synapse Network https://synapsetrading.com/wp-content/uploads/2026/10/synapse-logo-horizontal-light.png The Synapse Network2023-08-19 18:24:302026-09-28 11:14:31Bullish Irikubi & Bearish Irikubi Pattern
The Synapse Network

Bullish Gap and Bearish Gap Candlestick Patterns: How to Read Them

Technical Analysis & Price Action
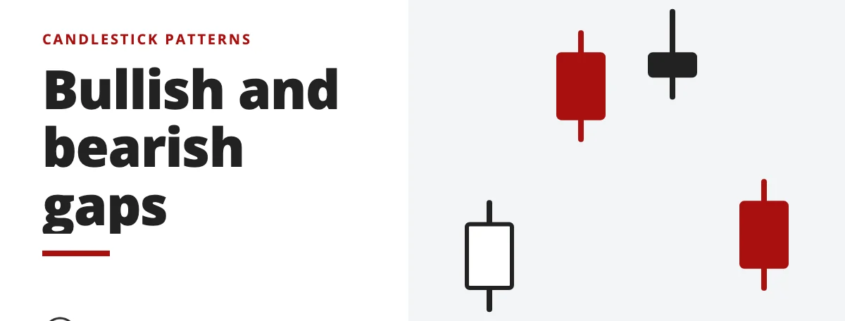
Bullish and bearish gaps - candlestick patterns

A bullish gap leaves empty space above the last candle, a bearish gap below it. What each means, the four kinds, and why not every gap gets filled.
18 Aug 2023Read the guide ›

by The Synapse Network
https://synapsetrading.com/wp-content/uploads/2026/10/bullish-gap-bearish-gap-candlestick-pattern-card.webp 630 1200 The Synapse Network https://synapsetrading.com/wp-content/uploads/2026/10/synapse-logo-horizontal-light.png The Synapse Network2023-08-18 16:46:242026-10-27 07:23:49Bullish Gap and Bearish Gap Candlestick Patterns: How to Read Them
The Synapse Network

Rising Window and Falling Window: How to Read Gaps on a Candlestick Chart

Technical Analysis & Price Action
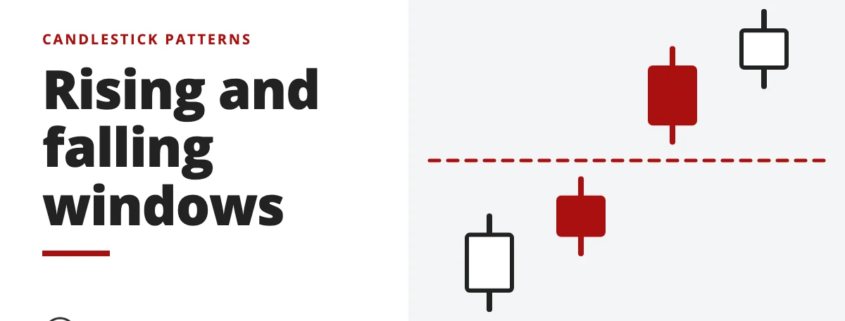
Rising and falling windows - candlestick patterns

A window is the Japanese candlestick name for a gap. How rising and falling windows work, why price comes back to them, and a real example.
13 Aug 2023Read the guide ›

by The Synapse Network
https://synapsetrading.com/wp-content/uploads/2026/10/rising-window-falling-window-pattern-card.webp 630 1200 The Synapse Network https://synapsetrading.com/wp-content/uploads/2026/10/synapse-logo-horizontal-light.png The Synapse Network2023-08-13 22:18:562026-10-26 17:20:55Rising Window and Falling Window: How to Read Gaps on a Candlestick Chart
The Synapse Network

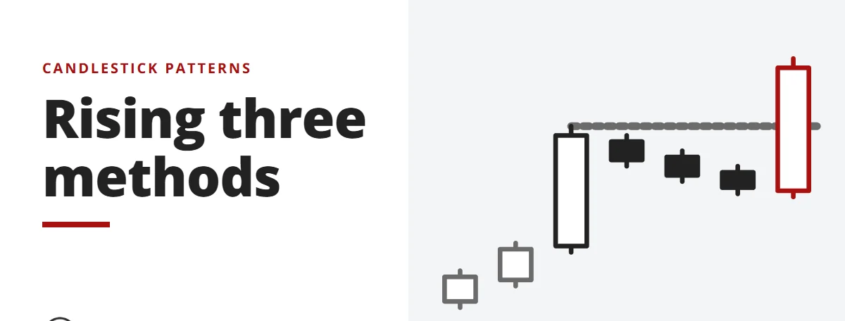
Rising Three Methods

Technical Analysis & Price Action
Rising three methods - candlestick patterns

Rising three methods is a bullish continuation pattern where a short pause inside an uptrend ends and the trend resumes. See how to spot and trade it.

13 Aug 2023Read the guide ›

by The Synapse Network
https://synapsetrading.com/wp-content/uploads/2026/10/rising-three-methods-card.webp 630 1200 The Synapse Network https://synapsetrading.com/wp-content/uploads/2026/10/synapse-logo-horizontal-light.png The Synapse Network2023-08-13 04:46:512026-08-31 08:03:06Rising Three Methods
Page 17 of 24«‹1516171819›»

Free checklist

The 15-Minute Swing Trader’s Checklist

The daily and weekly routine I use to find, manage and review trades in about 15 minutes a day, trading since 2007.

Get the free checklist

Topics

  • Trading foundations
  • Technical analysis
  • Strategies and systems
  • Risk and money
  • Trading psychology
  • Markets and products

Synapse Trading

Swing trading for busy professionals, in 15 minutes a day.

Start free

Learn

  • Start here
  • Free trading guides
  • Blog
  • Tools and resources

Programs

  • Trading Mastery Program
  • Daily trading signals
  • Student results
  • Public trade log

Company

  • About
  • Contact me
  • Partnerships
  • Disclaimer
  • Privacy policy
  • Terms & Conditions

Synapse Trading Pte Ltd
Registration No. 201316168H
WhatsApp +65-8897-1204
info@synapsetrading.com

Contact Us

Synapse Trading Pte Ltd
Registration No. 201316168H

Whatsapp: +65-8897-1204
Telegram: @iamrecneps
Email: info@synapsetrading.com

Links

Disclaimer
Privacy policy
Terms & Conditions
Contact us
Partnerships

© 2012-2026 Synapse Trading | All rights reserved. Educational content only, not personalised financial advice. Trading carries risk, including loss of capital. Past performance is not indicative of future results. Synapse Trading is not licensed or regulated by MAS.
  • Link to Facebook
  • Link to X
  • Link to Instagram
  • Link to Youtube
  • Link to LinkedIn
  • Link to Mail
Scroll to top Scroll to top Scroll to top