• Link to Facebook
  • Link to X
  • Link to Instagram
  • Link to Youtube
  • Link to LinkedIn
  • Link to Mail
Free PDF: The 15-Minute Swing Trader's Checklist, the daily routine on the record since 2014
Synapse Trading
  • Mentoring
    • Trading Mastery Program
    • All mentoring options
  • Signals
    • Daily trading signals
    • Signals trade log
  • Results
    • Student results and testimonials
    • Public trade log, losses left in
  • Free guides
    • Start here
    • Trading foundations
    • Technical analysis
    • Strategies and systems
    • Risk and money
    • Trading psychology
    • Markets and products
    • Free trading guides
    • Tools and resources
    • Blog
  • About
    • My background
    • My trading journey
    • Media and interviews
    • Travel log
  • Contact
    • Contact me
    • Partnerships
  • Start free
  • Click to open the search input field Click to open the search input field Search
  • Menu Menu
Spencer Li

10 Essential Trading Rules of Professional Traders

Trading Foundations
Ten rules of professional traders - trading rules

Have you ever wondered how professional traders see the market differently?

How do they stay consistent while most retail traders lose money?

Here are my top 10 trading rules I developed, and I hope that this will help you take your trading to the next level.

In this post, I’m going to talk about the trading rules which professional traders use, and how you can apply them to your own trading.
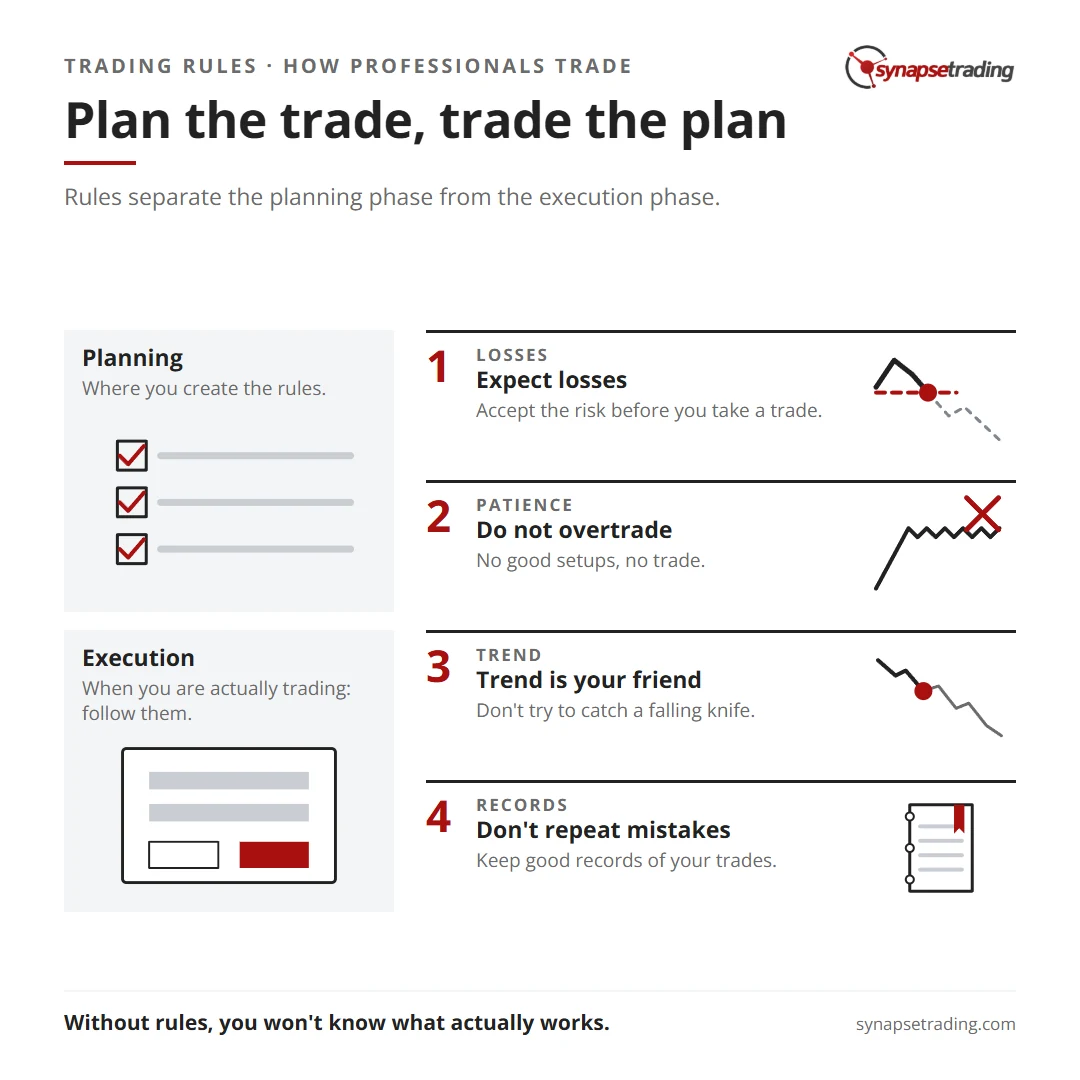
Plan the trade, trade the plan. Summary card for the post: 10 Essential Trading Rules of Professional Traders.

1. Always be disciplined

  • Follow your plan and rules
  • Do not be swayed by your emotions to act otherwise
  • Do not create excuses to break the rules – this time is NOT different!

2. Plan the trade, trade the plan

  • Always cut your losses according to plan
  • Always let your profits run according to plan
  • Separate your planning from your execution

3. Expect losses

  • Losses are part of trading – accept them. This will reduce emotional resistance when the time comes to do so.
  • Do not take a trade unless you are willing to accept the risk (possibility of loss) that accompanies the trade.
  • Accept that you will lose money on some trades
  • Take your losses easily when they come
  • Do not be stubborn and bend your rules

4. Manage your emotions

  • When in doubt or unsure, get out!
  • Always analyze objectively
  • Clear all positions to have a neutral frame of mind
  • Do not act based on greed or fear

5. Focus on trading well

  • The goal of a trader is to make the best trades
  • Money will naturally follow
  • If you focus on money, emotions will get in the way and you will not be able to make the best trades.

6. Do not overtrade

  • Be patient. Do not rush into a trade.
  • Do not trade when there are no good setups
  • Do not try to be in the market all the time
  • It is better to miss a boat, than to leave on one full of holes
  • One good trade is better than three bad trades
  • “There is a time to go long, a time to go short, and a time to go fishing.” – Jesse Livermore

7. Trade what you see, not what you think

  • Don’t concern yourself with why things are happening
  • Observe what is happening, and act on it
  • Ignore the noise – tips, rumours, news, speculations, etc
  • Anticipate the future, but trade in the present
  • Markets are never wrong, opinions are

8. The trend is your friend

  • Don’t enter just because it looks “overbought” or “oversold”
  • Don’t try to catch a falling knife
  • The easiest money is made trading with the trend
  • Make sure you have an edge before you enter the market
  • Put as many factors in your favour as possible

9. Do not repeat your mistakes

  • Keep good records of your trades and thought process
  • Analyze your mistakes, then move on
  • Do not make the same mistake again
  • Continuously improve yourself

10. Have realistic expectations

  • Do not try to make stellar returns overnight
  • Aim for small consistent returns over a period of time
  • Do not expect to become an expert overnight
  • Trading takes time to build experience

Summary

The difference between a newbie trader and a successful trader is how good their trading rules are, and how well they can follow their rules.

If you trade without any rules, you will always be second-guessing your decisions, and then regretting your decisions when they turn out to be wrong. This creates a lot of unnecessary mental anguish.

With trading rules, it reduces the stress of decision-making, because you can separate the planning phase (where you create the rules) from the execution phase (when you are actually trading).
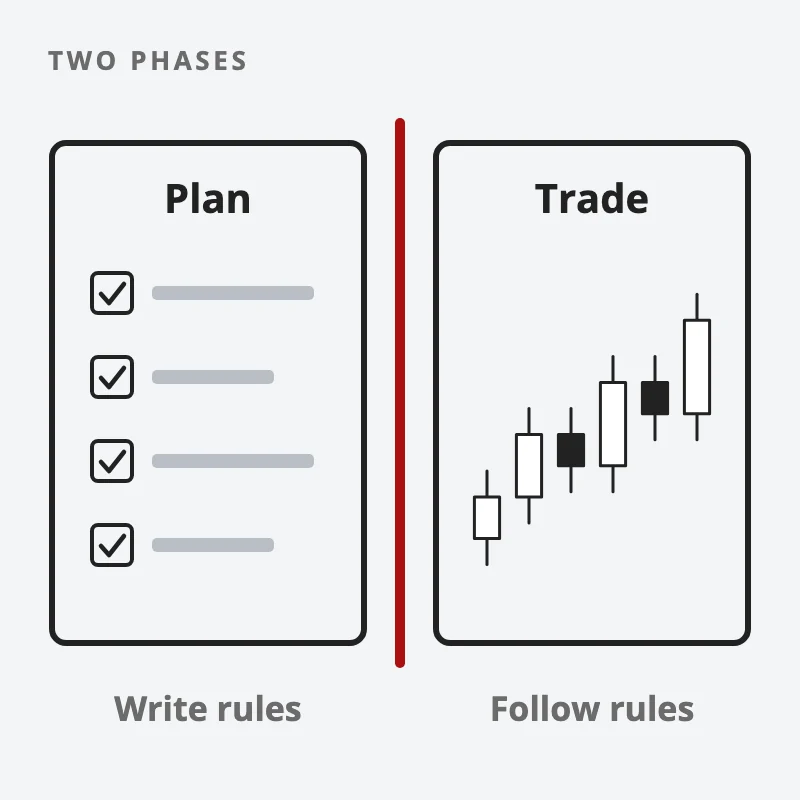
Two boxes split by a red wall: in the planning phase you write the rules as a checklist, in the trading phase you only follow them
Write your rules while planning, then simply follow them while trading.

Lastly, having rules makes it easier to systematically replicate your success over and over again, because once you know which rules work, you can apply them the same way every time and measure what changes, whereas if you don’t have rules, you won’t know what actually works.

Now that I have shared all my best trading rules, which rule do you think will make the biggest difference in your trading results?

Let me know in the comments below.


About the author. Spencer Li is The 15-Minute Trader and the founder of Synapse Trading. He is a Certified Financial Technician (CFTe) with 15+ years of trading, run from 70+ countries. He holds a B.Acc and B.BM from SMU. Every trade he takes is public, dated, losses left in. He teaches rules-based swing trading in 15 minutes a day, one system for any market.

Education, not financial advice. Synapse Trading is not licensed by MAS to advise on investment products. Trading carries risk of loss; past performance is not indicative of future results.
by Spencer Li
https://synapsetrading.com/wp-content/uploads/2026/10/trading-rules-professional-card.webp 630 1200 Spencer Li https://synapsetrading.com/wp-content/uploads/2026/10/synapse-logo-horizontal-light.png Spencer Li2015-04-29 08:00:142026-10-22 01:57:5510 Essential Trading Rules of Professional Traders
Spencer Li

The Quest for the Holy Grail: Secrets, Gurus & Software

Trading Foundations
No holy grail in trading - trading myths

Another big danger to new traders is the idea of the holy grail of trading.

To many, the holy grail of trading is deemed to be the ultimate solution to all their trading problems, the magic bullet that will allow them to profit without effort, the secret trading method or tool that will allow them to predict the market and win on every trade. However, far from being the solution, this mentality often acts as a stumbling block to all traders, if not a brick wall.

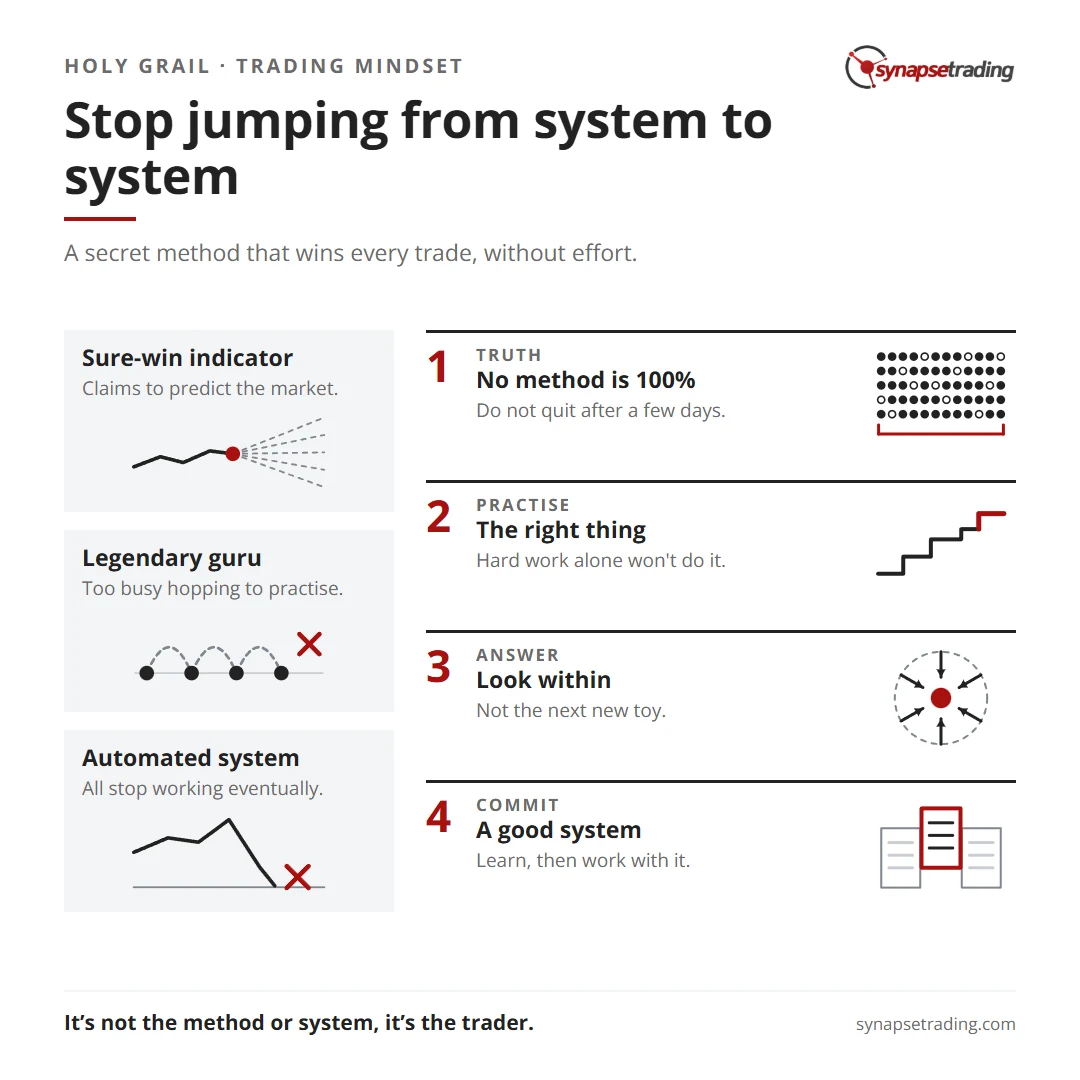
Stop jumping from system to system. Summary card for the post: The Quest for the Holy Grail: Secrets, Gurus & Software.

Many people hop from tip to tip, from guru to guru, from one software to another, attending every seminar and learning from every guru, but they will never be contented, and they will never become good traders, because they are too busy finding the holy grail to put their knowledge into practice. So what is the holy grail?


The Quest for the Holy Grail


The holy grail can appear in many forms – a “sure-win” indicators, a “100% win rate” trading system, a “legendary” guru, or a “unique proprietary” software guaranteed to make you rich overnight.

They all hold the same promise – to make you rich quickly with little effort.

Unfortunately, there is no shortcut to success, no magic bullet that will make you a super trader overnight.

To them, the answer is always so near, yet always slightly out of reach. Every time they see a new method, they think “this must be it, this must be the missing ingredient.” They test it out for a few days, realise that it’s not perfect, then skip off to find the next new toy. Many don’t realise that no method is 100%.

Many people also mistake sophistication for perfection, opting to fork out money for automated systems that will print money for them as they sleep at night. However, when the system stops printing money, as all do eventually, they are once again off to find the next holy grail.

It took me many years to realise it, and I have been through at least 200 books and tried almost every method or tool available, before I finally realised that to find the holy grail, one has to look within. So if you want to start learning the skills to make consistent money on your own, you need to first get rid of this stumbling block.

Many people in trading start off with the wrong ideas, and after sacrificing a lot of time and spending a lot of money, they wonder why they still cannot get the results they desire. Others think that hard work can solve everything, and given enough time, they will naturally pick up the skills themselves. Not many succeed in re-inventing the wheel. As a world-class tennis coach used to say, “Practise makes perfect, nut make sure you are not practising the wrong thing.”

“It’s not the method or system, it’s the trader.”

So, my advice to new traders is to stop jumping from system to system, hoping to find the holy grail (which does not exist).

Instead, start learning as much as you can, then find a good system and work with it until you find success.


thumbnail beginner guide to trading and TA

If you would like to learn how to get started in trading, also check out: “The Beginner’s Guide to Trading & Technical Analysis”

1 Comment/by Spencer Li
https://synapsetrading.com/wp-content/uploads/2026/10/holy-grail-trading-card.webp 630 1200 Spencer Li https://synapsetrading.com/wp-content/uploads/2026/10/synapse-logo-horizontal-light.png Spencer Li2012-05-19 21:27:082026-10-22 02:13:33The Quest for the Holy Grail: Secrets, Gurus & Software
Spencer Li

Warning to Beginners: Avoid the Indicator Trap

Trading Foundations
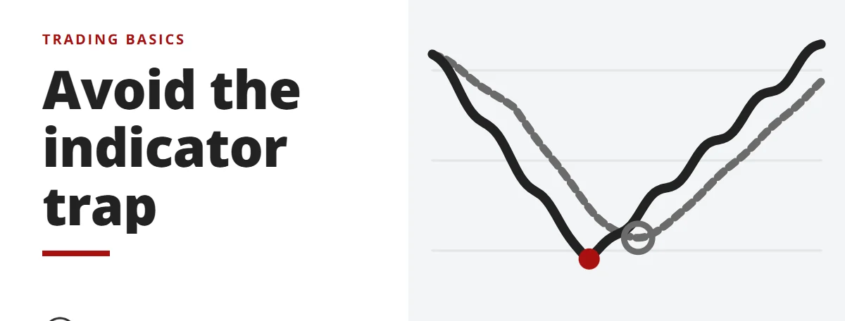
Avoid the indicator trap - trading basics

It is easy to see why retail traders find indicators appealing because of their ease of use and clear-cut signals. In fact, many new traders think they know all about trading because they have learnt a few basic indicators that generate simplistic buy/sell signals. This kind of thinking is dangerous because it shuts them off from learning real trading skills like price action and behavioral analysis.


Indicator Trap

 
Learn price action before you lean on indicators. Summary card for the post: Warning to Beginners: Avoid the Indicator Trap.

What are indicators and how are they derived?

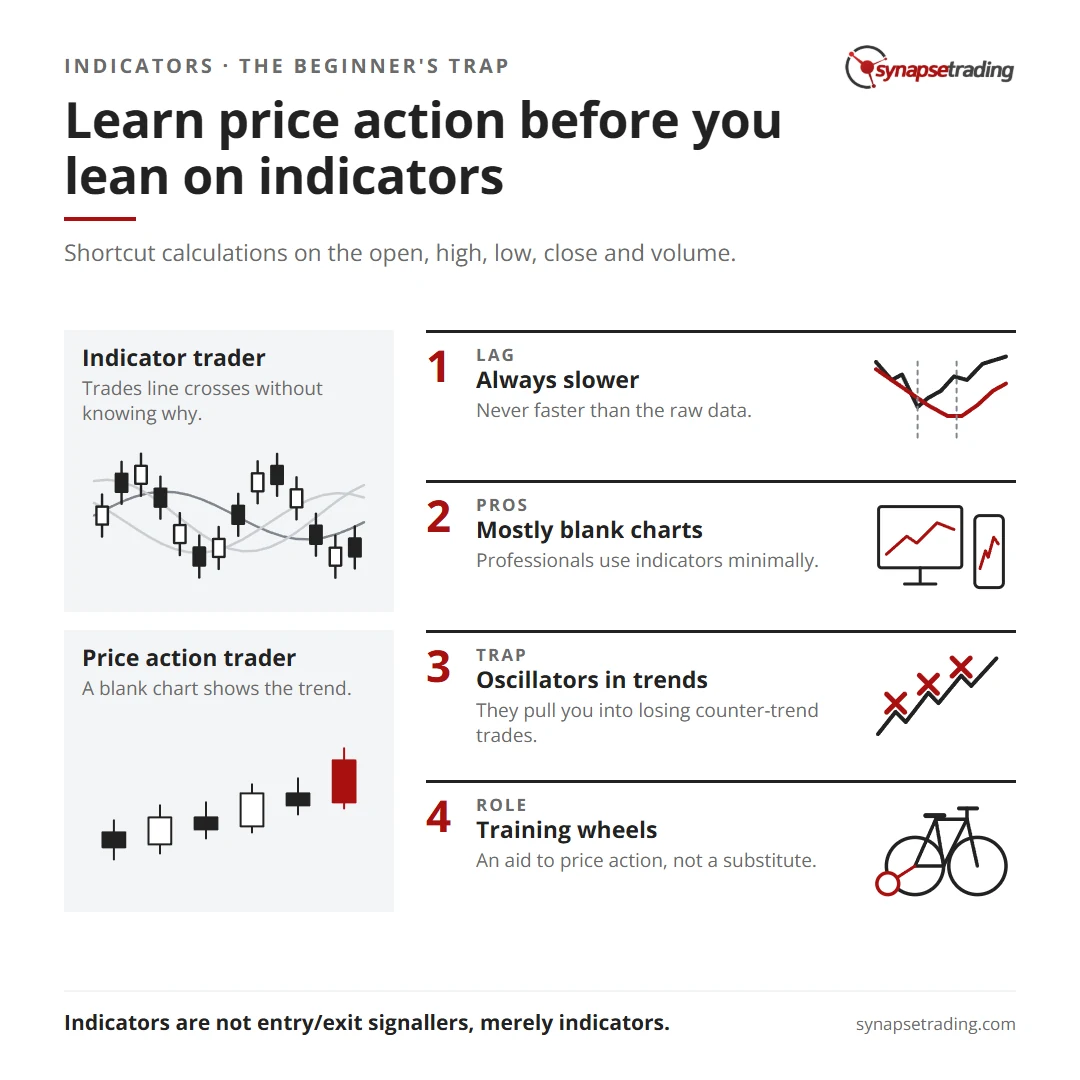
There are only five pieces of information we can get from charts: the open, high, low, close and volume. A skilled trader can interpret this in terms of market behaviour of psychology instead of processing it as a bunch of numbers. Indicators, on the other hand, attempt to use shortcut calculations to give meaning to these numbers. As a result, they can never be faster than reading the actual raw data. Manipulating data may also mask its information quality and granularity, causing you to miss out essential essential details.

Do professionals use them?

The answer is minimally. If you go to any bank/fund or professional trading arcade, and observe the traders who trade there, you will notice that their charts are mostly blank. This is not coincidence, because such a chart setup is optimised for reading price action, with as little distractions as possible. If you don’t believe me, go check it out yourself. As said by the famous Leonardo Da Vinci, “Simplicity is the ultimate sophistication.”

The dangers of using indicators without real trading skills

Many traders, especially beginners, are drawn to indicators, hoping that an indicator will show them when to enter a trade. what they don’t realise it that the vast majority of indicators are based on simple price action. Oscillators tend to make traders look for reversals and divergences, and when the market is trending strongly (best chances to make money), they will be repeatly entering counter-trend and losing money. By the time they come to accept that the market is trending, it will be too late to get a good entry to recoup their losses. Instead, if you were simply looking at a blank chart, it would be obvious when a market is trending, and would not be tempted by indicators to keep looking for reversals.

Common heuristics such as “buy when this line crosses this line” or “sell when this is in the overbought region” are some overly simplistic ways of using indicators. Trading in this manner does not give you any understanding about the market. It does not answer the “why” question, such as why this line crossing that line generates a buy signal. Quite often, one may also get conflicting signals from different indicators, and without an understanding of price action, one has no way of resolving the conflict.

Are indicators really needed for your decision-making?

Some pundits recommend a combination of time frames, indicators, wave counting, and Fibonacci retracements and extensions, but when it comes time to place the trade, they will only do it if there is a good price action setup. Also, when they see a good price action setup, they start looking for indicators that show divergences or different time frames for moving average tests or wave counts or Fibonacci setups to confirm what is in front of them.

In reality, they are price action traders who are trading exclusively off price action but don’t feel comfortable admitting it. They are complicating their trading to the point that they certainly are missing many, many trades because their over-analysis takes too much time, and they are forced to wait for the next setup. The logic just isn’t there for making the simple so complicated.

So… Should I be using indicators at all?

The best solution for the retail investor would be to first master a firm foundation of price action and behavioral analysis, and subsequently, should he choose to use indicators, should remember that as their name suggests, they are not “entry/exit signallers”, but merely “indicators”.

Therefore, it is a matter of how you use indicators, and one should always keep in mind that indicators are there to aid you in reading the price action, and not act as a substitute for it. You can think of indicators as the training wheels of a bicycle – you will want to remove them once you learn how to ride properly.

Trading always involves uncertainty, and trying to find comfort in the certainty of indicators will lead to constant indecision, second-guessing and parameters-tweaking.


thumbnail beginner guide to trading and TA

If you would like to learn how to get started in trading, also check out: “The Beginner’s Guide to Trading & Technical Analysis”

1 Comment/by Spencer Li
https://synapsetrading.com/wp-content/uploads/2026/10/avoid-indicator-trap-card.webp 630 1200 Spencer Li https://synapsetrading.com/wp-content/uploads/2026/10/synapse-logo-horizontal-light.png Spencer Li2011-04-07 01:45:322026-07-24 22:16:32Warning to Beginners: Avoid the Indicator Trap
Spencer Li

The Time Element – Choosing the Correct Timeframe

Trading Foundations
Choose the right timeframe - price action

Every trader knows that using multiple timeframes can provide different perspectives on the market, and provide key information on the lead-lag relationship.

Small timeframes lead larger ones, and larger ones drive the smaller ones. Understanding the inter-play is crucial.

Use one chart as the map, one to time trades. Summary card for the post: The Time Element - Choosing the Correct Timeframe.

Since trends exist on different timeframes, it makes sense to analyse at least two timeframes.

For example, if one’s main timeframe is the daily chart, one can consult the weekly chart to see the big picture.

This allows investors to analyze a particular trend against the perspective of the next higher timeframe.

If one is using swing counts, a lower/higher high/low in the weekly and monthly charts can provide perspectives not seen in daily charts.

Long-term trendlines may be clearer, and more obvious/easily visible.

Certain price patterns are more visible on long-term charts (key reversals, triangles on weekly), as well as long -term support and resistance levels.

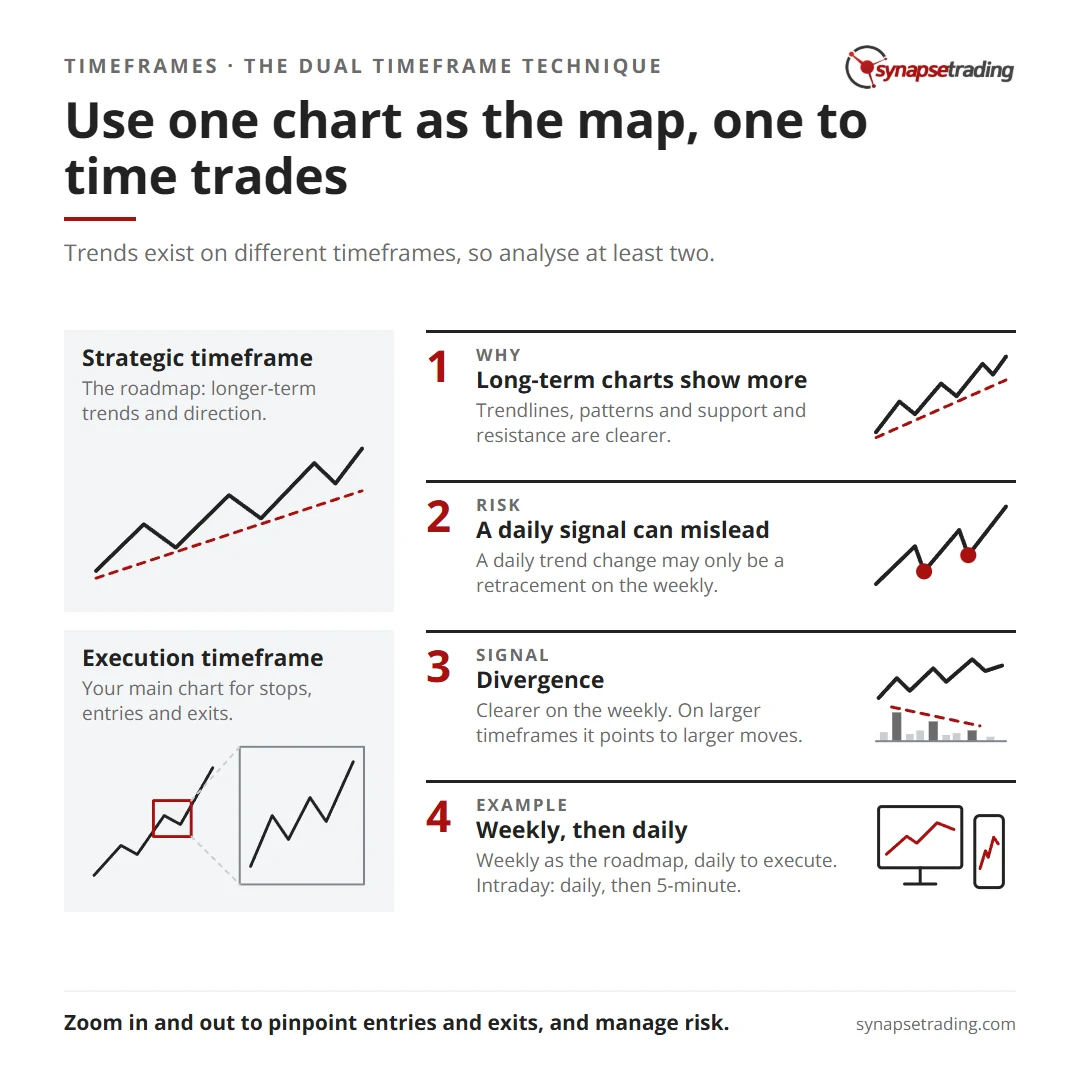
A trend change signal on the short-term (daily) may only be a retracement in the long-term (weekly) chart.

On the other hand, a trend change signal in the long-term chart may be a substantial move in the short-term even though a short-term move may seem overdone.

Hence, an overdone breakout on the short-term trend may actually be the start of a major breakout if the long-term chart is still on an uptrend.

Divergence signals are also more obvious when timeframe is compressed, for example a price-volume divergence is more obvious on the weekly compared to the daily.

Divergences on the larger timeframes also point to larger moves, and could herald major reversals.

Choosing the Correct Timeframe


The Dual Timeframe Technique 

This involves using 2 different timeframes to trade, one to provide the roadmap and the other to time the precise entries and exits.

Strategic Timeframe: This timeframe acts as a roadmap for the execution timeframe, giving you an idea of longer-term trends, hence providing you strategic direction on how to select your setups and manage your trades.

Execution Timeframe: This is your main timeframe for trading, and will be what you are looking at as you decide on your stoploss, entries, and exits. The focus is on precision and timing, so this timeframe is like zooming in from your strategic timeframe.

For example, for my strategies, I use:

  • Strategic Timeframe: Weekly chart
  • Execution Timeframe: Daily chart
  • Expected holding period: Can last for a few days to a few weeks (if the trend is strong)

If you are doing intraday trading, then your strategic timeframe might be the daily chart, while your execution timeframe might be the 5-minute or 15-minute chart.

In conclusion, using multiple timeframes allows one to better identify trends, and more precisely pinpoint entries and exits by zooming in and zooming out from the initial point of reference.

This also allows one to better manage risk in line with one’s time horizon and investment timeframe.


thumbnail beginner guide to trading and TA

If you would like to learn how to get started in trading, also check out: “The Beginner’s Guide to Trading & Technical Analysis”


3 Comments/by Spencer Li
https://synapsetrading.com/wp-content/uploads/2026/10/combining-multiple-timeframes-card.webp 630 1200 Spencer Li https://synapsetrading.com/wp-content/uploads/2026/10/synapse-logo-horizontal-light.png Spencer Li2011-01-13 01:31:182026-10-14 20:30:15The Time Element – Choosing the Correct Timeframe
Spencer Li

What Moves Prices in the Financial Markets?

Trading Foundations
What moves market prices? - markets

Despite what people may otherwise tell you or any preconceived ideas you may have, there are only two things that move stock prices.

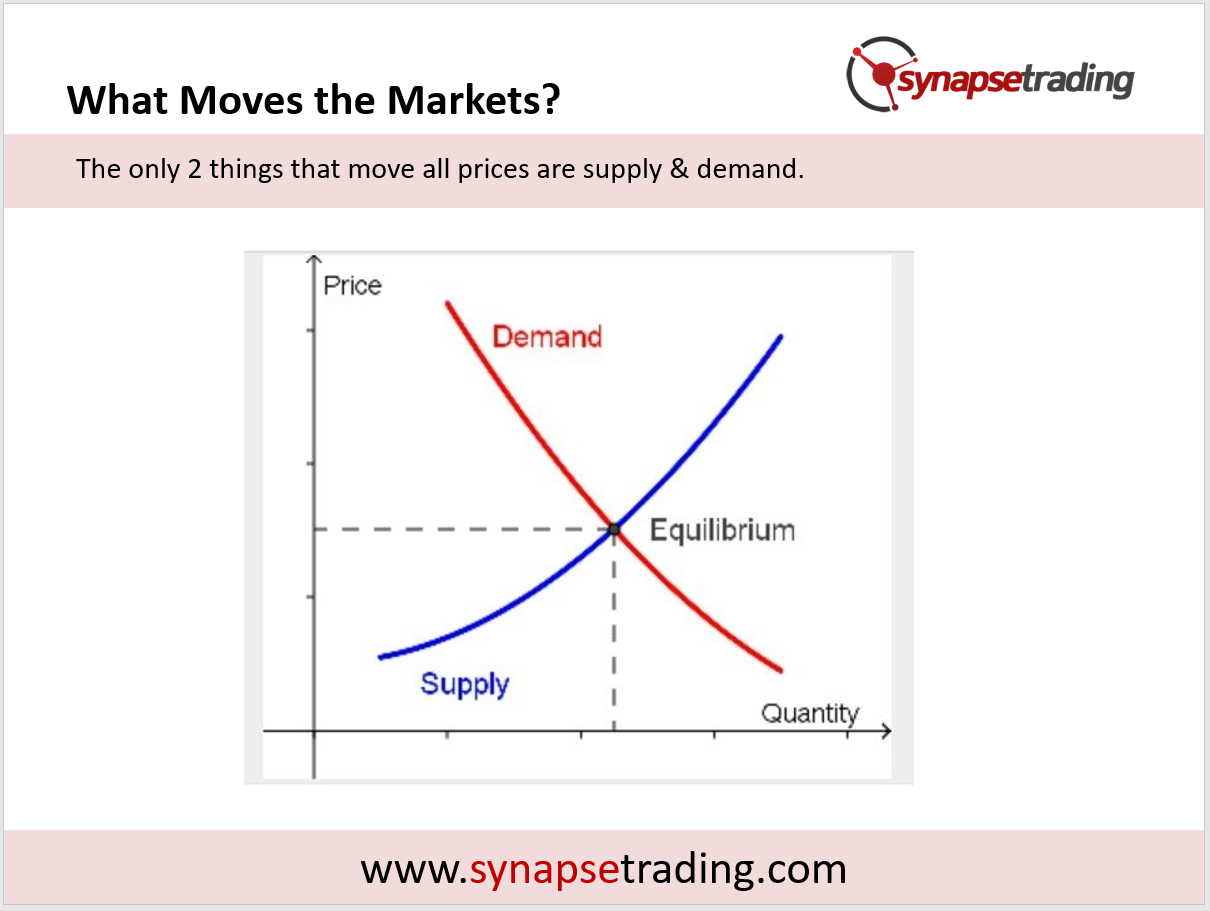
They are supply and demand – nothing more and nothing less. This is the foundation of basic economics as shown in the graph below.

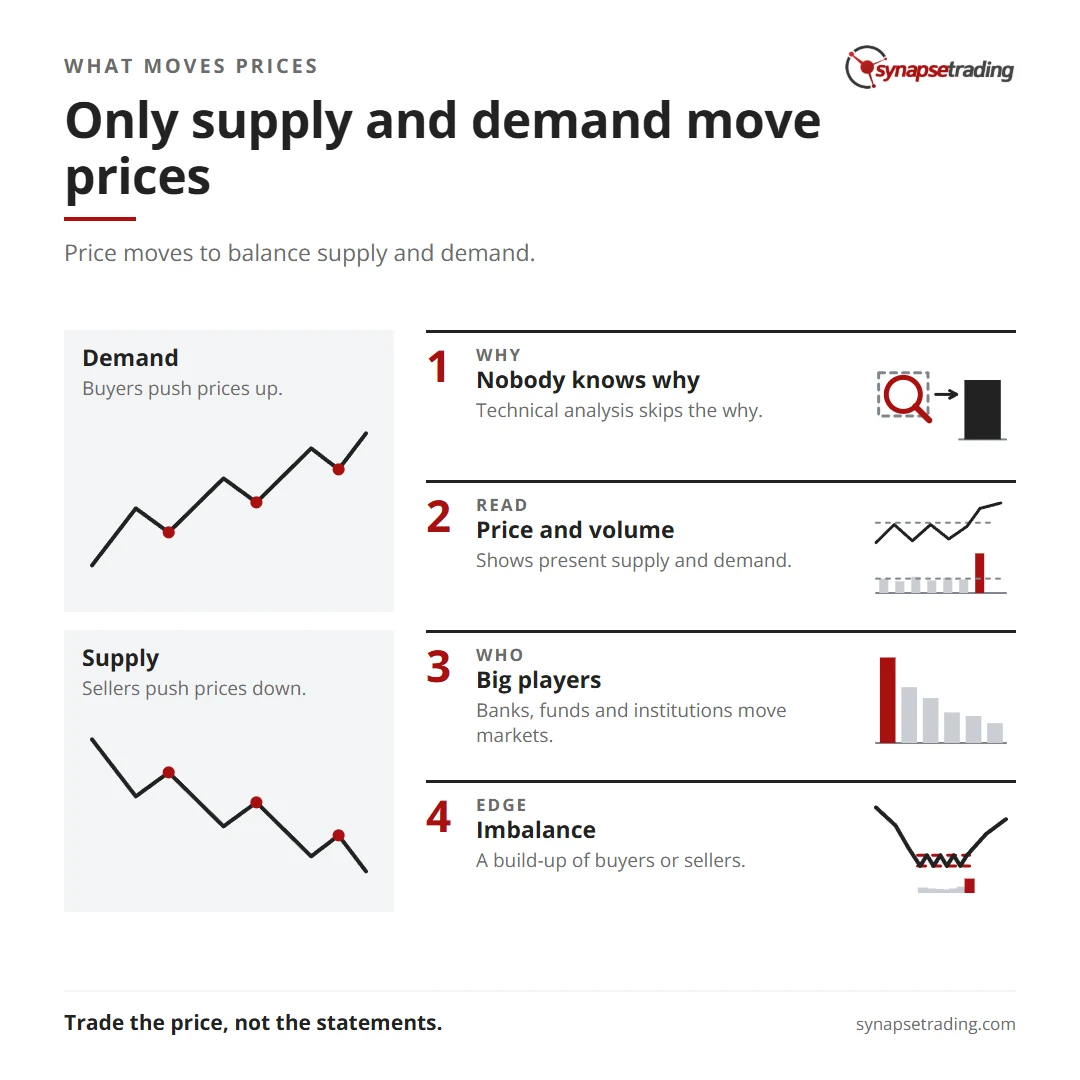
Only supply and demand move prices. Summary card for the post: What Moves Prices in the Financial Markets?.

Price is what moves to balance supply and demand.

If there is more demand than supply for a stock, then the price shall rise.

Conversely, if there is more supply than demand for something, then the price shall fall.

This is absolutely true in any market.

what moves market prices supply demand


The next question is what affects the supply and demand for a particular security or traded instrument.

Is it the profits in the financial statements? The upcoming expansion plans? The new product? Is it dividend payments?

No one can be absolutely sure at any point why people may be buying and selling shares.

That’s where technical analysis comes into play.

At no time does technical analysis attempt to determine why there might be supply and demand, only that there are certain levels of supply and demand.

By studying actual movements in the price and volume, we can go a long way to determining what the present demand and supply is and therefore judging which way price is more likely to go.

All fundamental and economic influences on a share price are already taken into consideration in the market, which is reflected in the price.

As a trader, what you are buying and selling is the actual price, not financial statements or ratios like the P/E ratio or ROE figures.

Ultimately, it is the price that ultimately determines whether you make money or not, and what you think the price should be has NO influence whatsoever on the price.

The next big revelation is that the bulk of supply and demand does not come from retail traders or retail investors.

They come from the big boys (BB) and smart money (SM) like traders and fund managers in banks, funds and other institutions.

They are the ones who move the market.

Learning to interpret price action and volume is our window to tap into their psyche and profit from their actions.

who controls market bulls bears

Supply refers to the sellers (bears) who are looking to sell (which pushes prices down), whereas demand refers to the buyers (bulls) who are looking to buy (which pushes prices up).

The constant battle between the buyers and sellers creates fluctuations in prices, which can be as short as a few seconds, or create trends which can last for years.

As a trader, finding the sweet spot where there is an imbalance in the forces (such as a huge build-up of buyers or sellers on either side) can give you an edge in the market, so that you can enter the market just as a big move is about to occur.


thumbnail beginner guide to trading and TA

If you would like to learn how to get started in trading, also check out: “The Beginner’s Guide to Trading & Technical Analysis”

by Spencer Li
https://synapsetrading.com/wp-content/uploads/2026/10/move-market-prices-card.webp 630 1200 Spencer Li https://synapsetrading.com/wp-content/uploads/2026/10/synapse-logo-horizontal-light.png Spencer Li2010-04-22 17:08:512026-10-22 02:09:41What Moves Prices in the Financial Markets?
Page 11 of 12«‹9101112›

Free checklist

The 15-Minute Swing Trader’s Checklist

The daily and weekly routine I use to find, manage and review trades in about 15 minutes a day, on the record since 2014.

Get the free checklist

Topics

  • Trading foundations
  • Technical analysis
  • Strategies and systems
  • Risk and money
  • Trading psychology
  • Markets and products

Synapse Trading

Swing trading for busy professionals, in 15 minutes a day.

Start free

Learn

  • Start here
  • Free trading guides
  • Blog
  • Tools and resources

Programs

  • Trading Mastery Program
  • Daily trading signals
  • Student results
  • Public trade log

Company

  • About
  • Contact me
  • Partnerships
  • Disclaimer
  • Privacy policy
  • Terms & Conditions

Synapse Trading Pte Ltd
Registration No. 201316168H
WhatsApp +65-8897-1204
info@synapsetrading.com

Contact Us

Synapse Trading Pte Ltd
Registration No. 201316168H

Whatsapp: +65-8897-1204
Telegram: @iamrecneps
Email: info@synapsetrading.com

Links

Disclaimer
Privacy policy
Terms & Conditions
Contact us
Partnerships

© 2012-2026 Synapse Trading | All rights reserved. Educational content only, not personalised financial advice. Trading carries risk, including loss of capital. Past performance is not indicative of future results. Synapse Trading is not licensed or regulated by MAS.

  • Link to Facebook
  • Link to X
  • Link to Instagram
  • Link to Youtube
  • Link to LinkedIn
  • Link to Mail
Scroll to top Scroll to top Scroll to top