

How to Backtest a Trading Strategy: Six Steps, and the Numbers That Tell You It Is Real
Want the daily routine? Get the free 15-Minute Swing Trader’s Checklist. Get it free →
Most backtests flatter the strategy. Here is how to run one that can tell you no
Published: 17 October 2026 · Last updated: 17 October 2026 · By Spencer Li, CFTe
A swing trader who traded Singapore stocks had a strategy that worked. Over 3 years of testing it showed +14%, and the live trades were winning about half the time. Then, as the trader wrote in a Reddit post this year, “Then I ran the full 10-year backtest on ~600 SGX stocks with real costs.” The result was −78.9%. Brutal. The trader’s verdict: “The edge never existed.”
That is what a backtest is for. It is a way to find out a strategy does not work before the market charges you to find out.
So how do you backtest a trading strategy properly? Write the rules down so a stranger could follow them. Test them on enough data, with real costs. Read profit factor, expectancy and drawdown instead of total return. Hold some data back that you never look at until the end. Then trade it small before you trust it. The six steps below go through each one.
What is a backtest, and what can it actually tell you?
A backtest runs your trading rules over past prices to see what would have happened. Think of it as a driving test on a simulator. Passing it does not make you a good driver. Failing it tells you clearly that you are not ready for the road.
That is the right way to think about every result you get. A backtest is very good at rejecting a bad idea and quite poor at predicting how much a good one will make.
How do you backtest a trading strategy, step by step?
Step 1: write the rules so a stranger could follow them. Entry, stop, exit and position size, all in plain words with numbers. “Buy strong stocks on a dip” cannot be tested. “Buy when price closes above the 20-day average after a 3-day pullback, with the stop below the pullback low” can.
Step 2: get enough clean data. Two things matter here. You need enough trades, and you need the stocks that died. A test that only uses stocks still listed today quietly leaves out every company that went bust, so it measures only the survivors. That is called survivorship bias, and it makes almost every strategy look better than it is.
Step 3: charge real costs. Commission, the bid-ask spread, and slippage on your stops. The SGX trader above named fake costs as one of his four traps. On a short-term strategy with a tight stop, costs can be the difference between a small edge and a steady loss.
Step 4: read the right numbers. Total return tells you very little on its own. The numbers that matter are in the table further down.
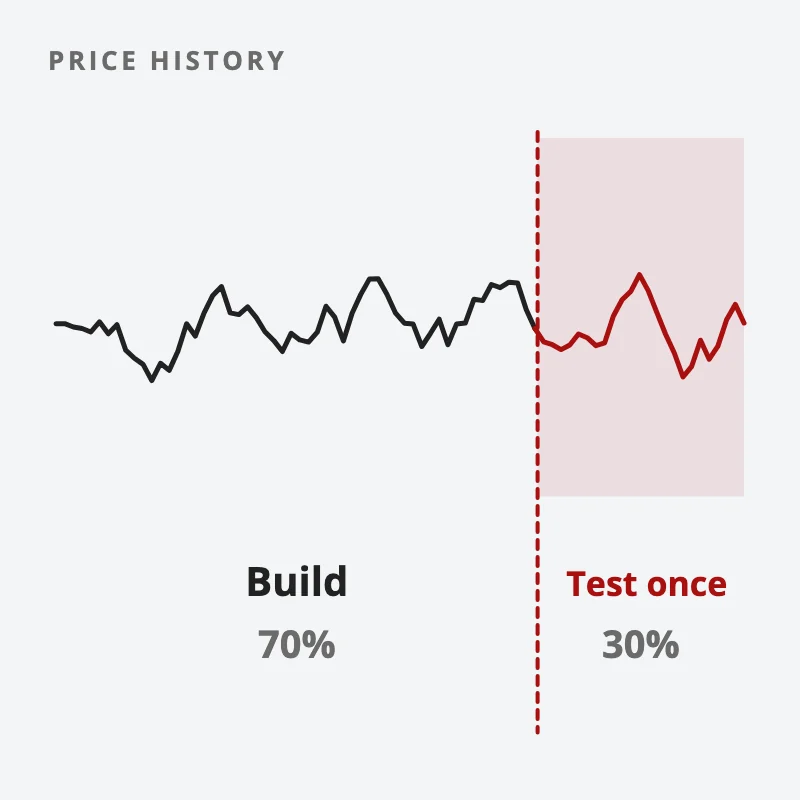
Step 5: hold data back. Build and tune the strategy on about 70% of your history. Then test it once on the 30% you never touched. If it falls apart there, it was fitted to the past.
Step 6: forward test, then trade it small. Paper trade it on new data, or trade it with very small size. This is the only test where the future is truly unknown. Paper trading alternatives covers the ways to do this without risking much.
Can you backtest a strategy in TradingView?
Yes, for a quick first look. TradingView’s Strategy Tester is fast and free to start, which makes it a good place to prototype an idea. Do note its limits. It tests one symbol at a time, and how much history you get depends on your plan.
So a TradingView result on one stock is step 1 of the job. For a test across a whole market, over many years, with the dead stocks included, you need a coding tool such as Python and a data set that keeps delisted stocks.
How many years of data do you need for a backtest?
Enough to get a few hundred trades through more than one kind of market. A trader on Reddit argued the opposite: “backtest 1-2 years, more will hinder you.” That comment got 384 upvotes, and the appeal is easy to see, because recent data feels more relevant.
But look at the SGX trader again. The 3-year window said +14%. The 10-year test said −78.9%. The short window happened to catch a market that suited the strategy, which is the “window luck” the trader named as the first trap.
Short tests have a second problem. With only 40 trades, a strategy with no edge at all can show a great result by pure chance, in the same way that a coin can land heads 7 times in 10 without being a loaded coin. The law of large numbers explains why you need a few hundred before the average means much.
If you want a routine that keeps you testing one rule at a time instead of chasing the next idea, our free 15-Minute Swing Trader’s Checklist is a good place to start. Get the free checklist →
Which backtest numbers actually matter?
Here are the numbers worth checking, with rough bands. They are a guide, and the right numbers depend on the market and the style.
| Number | Weak | Good | Too good to be true |
| Profit factor (gross wins ÷ gross losses) | Below 1.25 | 1.5 to 2.5 | Above 4, on a small sample |
| Sharpe ratio, yearly | Below 0.5 | 1 to 2 | Above 3 |
| Worst drawdown | Above 30% | 10% to 20% | Below 5% on few trades |
| Expectancy | Below 0R | Clearly above 0R, on hundreds of trades | A large figure on a few dozen trades |
Notice the last column. A result that looks amazing is usually a warning. It most often means the rules were tuned until they fit the past, or the test is too short, or the costs are missing.
Expectancy is the one to learn first. It is the average result per trade, measured in R, where 1R is what you risk. A strategy that wins 45% of the time, with average wins of 2R and average losses of 1R, has an expectancy of 0.35R a trade. The trading expectancy formula works through it, and trading performance metrics covers the rest.
One more check takes 5 minutes and catches a lot. Nudge each setting a little, say a 20-day average to 18 and 22. A real edge sits on a plateau, so the results barely move. A fitted one sits on a spike, so they fall apart.
What does an honest backtest look like?
It has a pass mark written down before any code runs. Say how many trades the test must produce, how far above zero the edge must sit once you allow for chance, and how many of the years tested must be positive.
Then run the test once and hold the result to that mark. If it misses any bar, it fails, even when the average looks good. Keep the most recent stretch of data untouched, so the next idea still has a clean test waiting for it.
That is the part most people skip. Writing the pass mark down first stops you moving the goalposts, because once you see a result you like, it is easy to decide a smaller sample is plenty and a weaker year count is close enough.
In what order should you trust a backtest result?
From weakest to strongest, the order runs like this. Each rung costs more work and gives you more truth.
- A single backtest. One run on one data set. Good for throwing out bad ideas.
- In-sample and out-of-sample. Tune on 70%, test once on the 30% you held back.
- Walk-forward. Repeat that split many times, moving forward through history.
- Monte Carlo. Shuffle the trade order thousands of times to see the range of drawdowns you could have hit.
- Paper trading. Run it live on new data with no money.
- Small live money. Real fills, real emotions, small size.
A fair rule of thumb: anything below rung 2 is still an idea, and anything below rung 5 is unproven. Aronson made the same case at book length, and our review of Evidence-Based Technical Analysis sums up his argument.
So where does your current strategy sit on the ladder? And did you write down what would count as a fail before you looked at the results? If the honest answer is “rung 1” and “no”, that is your next weekend’s work. For the bigger picture, see the guide to trading strategies, and if you wonder whether a good run is real at all, read is trading skill or luck.
FAQ
How do you backtest a trading strategy?
Write the rules so anyone could follow them, run them over enough past data with real costs, and read profit factor, expectancy and drawdown. Then test once on data you held back, and forward test before you trust it.
Can I backtest for free?
Yes. TradingView’s Strategy Tester and a spreadsheet are enough for a first test on one market. A test across many stocks with delisted names included usually needs paid data.
How many trades do you need for a reliable backtest?
A few hundred is a sensible floor. Below about 100 trades, luck can easily produce a result that looks like an edge.
What is a good profit factor in a backtest?
Roughly 1.5 to 2.5. Below 1.25 is weak, and above 4 on a small sample usually means the strategy was fitted to the past.
Why does my strategy work in a backtest but fail live?
The usual reasons are missing costs, a test window that suited the strategy, settings tuned to past noise, and too few trades. An out-of-sample test and a small live run catch most of these.
Go deeper
A backtest only helps if you then follow the rules you tested. The free 15-Minute Swing Trader’s Checklist has the daily routine, the questions to ask before every trade, and the five rules that protect your account. Enter your email and we’ll send it over:
We use your email address to send you the checklist, then emails about trading and our courses. Unsubscribe in one click, any time. Privacy policy.
About the author. Spencer Li is The 15-Minute Trader and the founder of Synapse Trading. He is a Certified Financial Technician (CFTe) with 15+ years of trading, run from 70+ countries. He holds a B.Acc and B.BM from SMU. Every trade he takes is public, dated, losses left in. He teaches low-risk swing trading in 15 minutes a day, one system for any market.
Educational content only, not personalised financial advice. Trading carries risk, including loss of capital. Past performance is not indicative of future results. Synapse Trading is not licensed or regulated by MAS.
Want the daily routine? Enter your email for the free 15-Minute Swing Trader's Checklist.
Free 5-page PDF, then occasional trading emails. Education only, not financial advice. Unsubscribe anytime. Kit stores your email in the US: see our privacy policy.
Want to learn the full method? The Trading Mastery Program teaches the 4 strategies I have traded since 2011. It suits beginners and experienced traders.
Rather follow the trades as they happen? Daily Trading Signals is our Telegram channel: my trade ideas with entry, stop and exit, and every trade is public.
Questions about this post? Ask in the free Telegram channel →
Educational content only, not personalised financial advice. Trading carries risk, including loss of capital. Past performance is not indicative of future results. Synapse Trading is not licensed or regulated by MAS.

