

How to Use Fibonacci Retracement: Draw It Right, Then Treat It as a Zone
Want the daily routine? Get the free 15-Minute Swing Trader’s Checklist. Get it free →
The levels are easy to draw. Knowing when they mean something is the real skill
Published: 17 October 2026 · Last updated: 17 October 2026 · By Spencer Li, CFTe
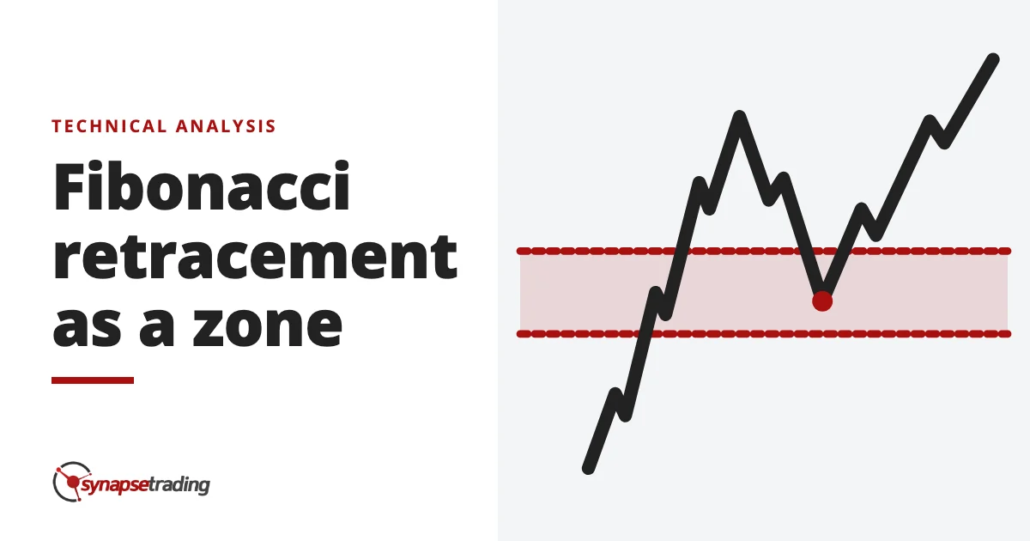
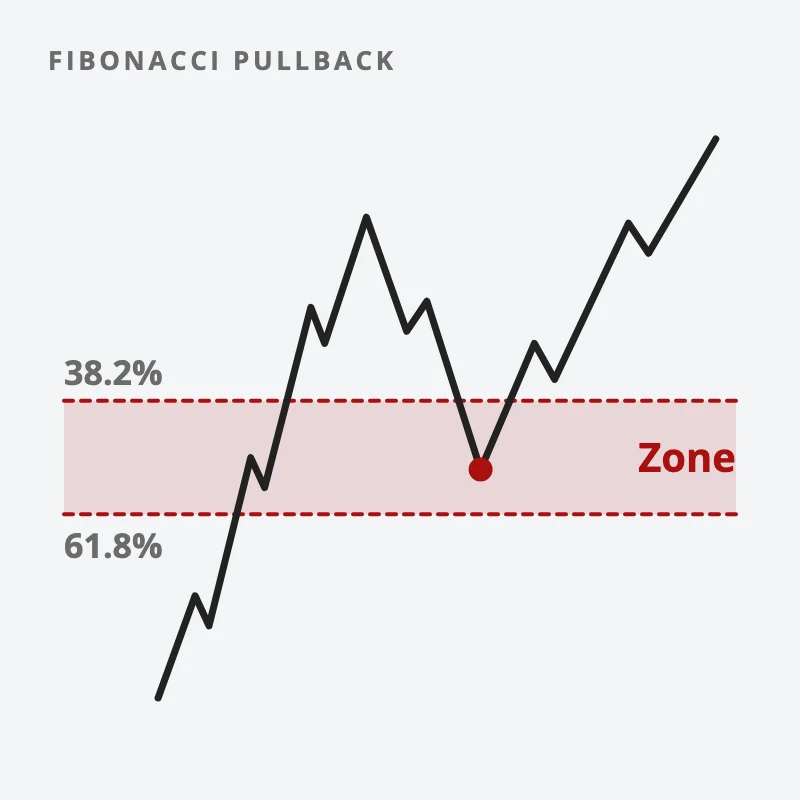
Fibonacci retracement is a drawing tool that marks where a pullback inside a trend might stop. You pick one clear swing, from the low to the high in an uptrend, and the tool draws horizontal lines at 23.6%, 38.2%, 50%, 61.8% and 78.6% of that move. Most traders watch the band between 38.2% and 61.8%.
To use it well, you do three things. You draw it only on a swing that clearly matters, inside a trend you can already see. You treat the band as a zone where buyers might return, rather than a price where they must. And you act only when something else on the chart agrees, like an old swing high or a moving average sitting in the same place.
That last part is where most people go wrong. The ratios have no special power on their own, and the classic textbooks say so quite openly. The rest of this post breaks the approach into three checks: the zone, the trend and a second witness.
Where do the Fibonacci levels come from?
They come from a number sequence, rather than from the market.
In the Fibonacci sequence (1, 1, 2, 3, 5, 8, 13, 21…), each number divided by the next one settles near 0.618, and divided by the one after that, near 0.382. Traders took those ratios and turned them into retracement levels. The 50% line is not a Fibonacci ratio at all. It is on the tool because traders have watched the halfway point for over a century.
Most guides skip what comes next. John Murphy’s 1999 textbook on technical analysis notes that Dow Theory already expected pullbacks of one-third, one-half and two-thirds of the prior move. The Fibonacci version is simply 38% and 62%, close neighbours of those older thirds. Murphy himself suggests blending them into a zone from roughly 33–38% to 62–66%.
So the useful idea is old and fairly plain. In a healthy trend, a pullback often gives back somewhere between a third and two-thirds of the last move before the trend resumes. The golden ratio is the decoration on top.
How do you draw Fibonacci retracement correctly?
You need a trend and one clean swing inside it. Without both, the lines mean nothing.
- Confirm the trend first. In an uptrend, price is making higher highs and higher lows. Our post on market structure shows how to read that quickly.
- Pick the most recent clear swing. Choose the obvious low where the move started and the obvious high where it paused. If you have to squint to find the swing, it is not clear enough.
- Draw from the low to the high in an uptrend, or from the high to the low in a downtrend. Most charting platforms, TradingView included, offer it as a standard drawing tool.
- Use the extremes of the candles. Draw from the wick, so the swing reflects the full range that traders actually saw.
- Leave it alone. Draw it once. If you keep moving the anchor points until a level lines up with a past bounce, you are fitting the tool to the chart.
Here is a worked example, so you can see the arithmetic. Say a stock climbs from USD 40 to USD 60, a swing of USD 20. Each level is that swing times the ratio, subtracted from the high.
| Level | Calculation | Price |
| 23.6% | 60 − 20 × 0.236 | 55.28 |
| 38.2% | 60 − 20 × 0.382 | 52.36 |
| 50% | 60 − 20 × 0.500 | 50.00 |
| 61.8% | 60 − 20 × 0.618 | 47.64 |
| 78.6% | 60 − 20 × 0.786 | 44.28 |
| Dow Theory’s one-third | 60 − 20 ÷ 3 | 53.33 |
| Dow Theory’s two-thirds | 60 − 20 × 2 ÷ 3 | 46.67 |
Look at the 38.2% to 61.8% band. It runs from 52.36 down to 47.64, which is almost USD 5 wide on a USD 60 stock, about 8% of the price. That is a zone, and a fairly wide one. Anyone who tells you price “respected the 61.8% to the cent” is describing luck, because a band that wide catches a lot of pullbacks by itself.
If you want a short routine for checking the trend and the swing before every trade, our free 15-Minute Swing Trader’s Checklist walks through it. Get the free checklist →
Do Fibonacci levels actually work?
As a map of where pullbacks often stop, roughly yes. As a precise signal, the evidence is thin.
Al Brooks, who writes some of the most detailed books on reading price bars, is blunt about it. He writes that “every pullback is ‘close enough’ to some Fibonacci number, making the Fibonacci numbers essentially meaningless.” With five lines spread across one swing, almost any turn lands near one of them, and then the line gets the credit.
Brooks does keep one door open, and it is the important one: “If a Fibonacci number is good, it will be associated with a chart pattern that is reliable and tradable on its own.” In plain words, when a Fibonacci level works, something else on the chart was usually doing the work.
A trader in an online forum put the popular defence this way: “A fib level becomes support/resistance because so many people use it.” It is a fair argument, and it is worth taking seriously. Crowds do gather at obvious prices. But the levels crowds really watch tend to be simple ones, like yesterday’s low, the last swing low or a round number. A Fibonacci grid is different. It sits somewhere new for every trader who anchors it on a slightly different swing.
Treat a Fibonacci zone the way you would treat any single indicator. On its own, a pullback to 61.8% with no trend behind it and no other reason to buy is close to a coin flip. When it lines up with an old swing high, a rising moving average or a clean price pattern, it becomes worth a look. That is the same lesson as our older warning to beginners about the indicator trap.
How do you trade a Fibonacci pullback?
Run three checks, each a question you ask before acting.
Zone. Is price inside the 38.2–61.8 band, and is it slowing down there? Treat the whole band as one area. A pullback that stops at 45% instead of 50% has not “failed” anything.
Trend. Is there a clear trend for the pullback to rejoin? A Fibonacci grid drawn inside a sideways range is just lines on a chart. Brooks adds a useful warning sign: once a pullback retraces 75% or more of the move, the odds that the trend resumes and makes a new high “fall substantially”. A pullback that deep is starting to look like a reversal.
Witness. Does something else agree? The best witnesses are price levels other traders already watch. An old resistance level that the pullback is now testing from above is a strong one, which our post on when resistance becomes support explains. A rising moving average in the same area is another.
Only when all three line up does the zone earn your attention. Even then, you still need the market to show you it is turning, like a strong candle closing back in the direction of the trend, before you commit any money.
Then comes the risk. Decide where the idea is wrong before you enter. For a pullback trade, that is usually beyond the far side of the zone and the swing that made it, so a deeper fall tells you the trend has changed. Size the position so that being wrong costs a small, fixed slice of your account. Our guide on where to put your stop loss covers the placement in detail.
What are the most common Fibonacci mistakes?
Most of them come from asking the tool to do more than it can.
- Drawing on a swing nobody else sees. A tiny swing on a 5-minute chart gives you levels that no other trader is looking at.
- Redrawing until it fits. Moving the anchors after the fact will always make the chart look magical, and it teaches you nothing about the next trade.
- Trading the line instead of the zone. Placing a limit order at exactly 61.8% often means you miss the turn by a few cents, or get filled in a pullback that keeps going.
- Ignoring the trend. In a range, every Fibonacci level is as good as every other one.
- Stacking tools for comfort. Fibonacci plus Elliott Wave plus three oscillators feels thorough. Mostly it gives you more lines to blame later.
The tool is fine. The trouble starts when it becomes the reason for a trade instead of one witness among several.
So, think about your last trade at a Fibonacci level. Was there a trend behind it, and was anything else on the chart agreeing with you? Or was the line the only reason you clicked buy? For the wider picture of reading charts this way, see the guide to price action trading. And if the history of the ratios interests you, our summary of Constance Brown’s book on Fibonacci analysis goes deeper.
FAQ
What are the Fibonacci retracement levels?
The standard levels are 23.6%, 38.2%, 50%, 61.8% and 78.6% of the prior swing. The 38.2% to 61.8% band is the one most traders watch.
Is 50% a Fibonacci level?
No. The 50% line is not a Fibonacci ratio. It is on the tool because traders have watched the halfway point of a move since Dow Theory.
Which Fibonacci level is the most important?
None of them on its own. The 61.8% level is the most famous, but the band from 38.2% to 61.8% matters more than any single line, and only when a trend and a second level agree.
What is the difference between Fibonacci retracement and extension?
A retracement measures how far a pullback goes back into the prior swing. An extension projects how far the next swing might run past the old high, at levels like 127.2% or 161.8%.
Does Fibonacci retracement work on every timeframe?
You can draw it on any chart. It is most useful on swings that many traders can see, such as on daily and weekly charts, and least useful on small intraday swings.
Go deeper
A Fibonacci zone is only one witness. The free 15-Minute Swing Trader’s Checklist has the daily routine, the questions to ask before every trade, and the five rules that protect your account.
About the author. Spencer Li is The 15-Minute Trader and the founder of Synapse Trading. He is a Certified Financial Technician (CFTe) with 15+ years of trading, run from 70+ countries. He holds a B.Acc and B.BM from SMU. Every trade he takes is public, dated, losses left in. He teaches low-risk swing trading in 15 minutes a day, one system for any market.
Educational content only, not personalised financial advice. Trading carries risk, including loss of capital. Past performance is not indicative of future results. Synapse Trading is not licensed or regulated by MAS.
Want the daily routine? Enter your email for the free 15-Minute Swing Trader's Checklist.
Free 5-page PDF, then occasional trading emails. Education only, not financial advice. Unsubscribe anytime. Kit stores your email in the US: see our privacy policy.
Want to learn the full method? The Trading Mastery Program teaches the 4 strategies I have traded since 2011. It suits beginners and experienced traders.
Rather follow the trades as they happen? Daily Trading Signals is our Telegram channel: my trade ideas with entry, stop and exit, and every trade is public.
Questions about this post? Ask in the free Telegram channel →
Educational content only, not personalised financial advice. Trading carries risk, including loss of capital. Past performance is not indicative of future results. Synapse Trading is not licensed or regulated by MAS.

