

Multiple Timeframe Analysis: How to Combine Two Charts and See the Real Trend
Want the daily routine? Get the free 15-Minute Swing Trader’s Checklist. Get it free →
By Spencer Li, CFTe · Last updated: 26 October 2026
Multiple timeframe analysis means reading the same market on at least two charts before you trade. A higher timeframe shows you the main trend, and a lower one times what you do inside it. It works because of a lead-lag relationship. Small timeframes lead the larger ones, and the larger ones drive the smaller ones. Read only one chart and you will regularly mistake a pullback for a trend change, or a real breakout for a move that has already run too far.
I first wrote this post in January 2011, and I called the higher chart “a roadmap”. Nearly fifteen years later, in my weekly outlook of 18 December 2025, I switched to weekly charts for the year-end review so that we would have “kind of a roadmap” for the year ahead. The word stuck because the idea did.
Why look at more than one timeframe?
A doctor can usually treat your liver without examining your heart. Donella Meadows uses that example in Thinking in Systems to explain why complicated things are built in layers. A liver cell sits inside an organ, which sits inside a body, and the cells inside one organ talk to each other far more than to anything outside it. So you can study one layer on its own, and you usually get away with it. Her catch is that there are just enough exceptions to make stepping back necessary.
A price chart is layered the same way. On a stock chart, each weekly bar is built from five daily bars, and each daily bar from hours of trading. The daily chart behaves like a system of its own, with its own swings and its own trends, and you can trade it alone for weeks without trouble. Then one week the layer above takes over.

The higher timeframe also shows you things the lower one hides. Since trends exist on different timeframes, it makes sense to check at least two. On a weekly or monthly chart:
- Trendlines are cleaner, because a week of noise gets squeezed into a single bar.
- Swing counts carry more weight. A lower high or a higher low on the weekly can show you something the daily never will.
- Certain price chart patterns, such as key reversals and triangles, stand out more clearly, and so do long-term support and resistance levels.
- Divergences are easier to see. A price-volume divergence that looks like a wobble on the daily can look obvious on the weekly.
Divergences on the larger timeframes also tend to point to larger moves, and some of them can herald major reversals. None of that is visible from inside the daily chart.
What is the lead-lag relationship between timeframes?
Every weekly trend begins life as a few daily bars that nobody takes seriously. That is the lead-lag relationship in one sentence. Small timeframes lead, because any change shows up there first. Larger timeframes drive, because once they turn, they pull the smaller ones along with them.
The trouble is that the small timeframe also produces plenty of false starts. A trend change on the daily chart may only be a retracement on the weekly. And a breakout on the daily that looks overdone may be the start of a major move, if the weekly trend still points the same way.
I saw this play out in my outlook of 4 December 2025, when I went through USD/SGD. In early November the daily chart had looked quite bullish. Prices were consolidating and had crossed over all the moving averages. Then on 24, 25 and 26 November came three days of what I called “long black bars”, and whatever bullishness there was “kind of ended there”. So I zoomed out. On the weekly chart it looked like “just a pull back”, and “the trend might continue downwards”. The daily had shown a trend change, while the weekly called it a bounce inside a bigger move.
Neither chart was wrong. They were answering different questions.
If you trade around a full-time job, you do not have time to read five charts a day. My free 15-minute swing trader checklist is the daily routine I use myself.
What is the dual timeframe technique?
In 2011 I described a simple way to put all this into practice, and I still use the idea today. You trade with two timeframes, and each one has a different job.
The strategic timeframe is the roadmap. It shows you the longer-term trend, so it gives you direction on which setups to select and how to manage the trades you are already in.
The execution timeframe is where you actually trade. It is what you look at when you decide on your entry, your stoploss and your exit. The focus here is precision and timing, so think of it as zooming in from the strategic chart.
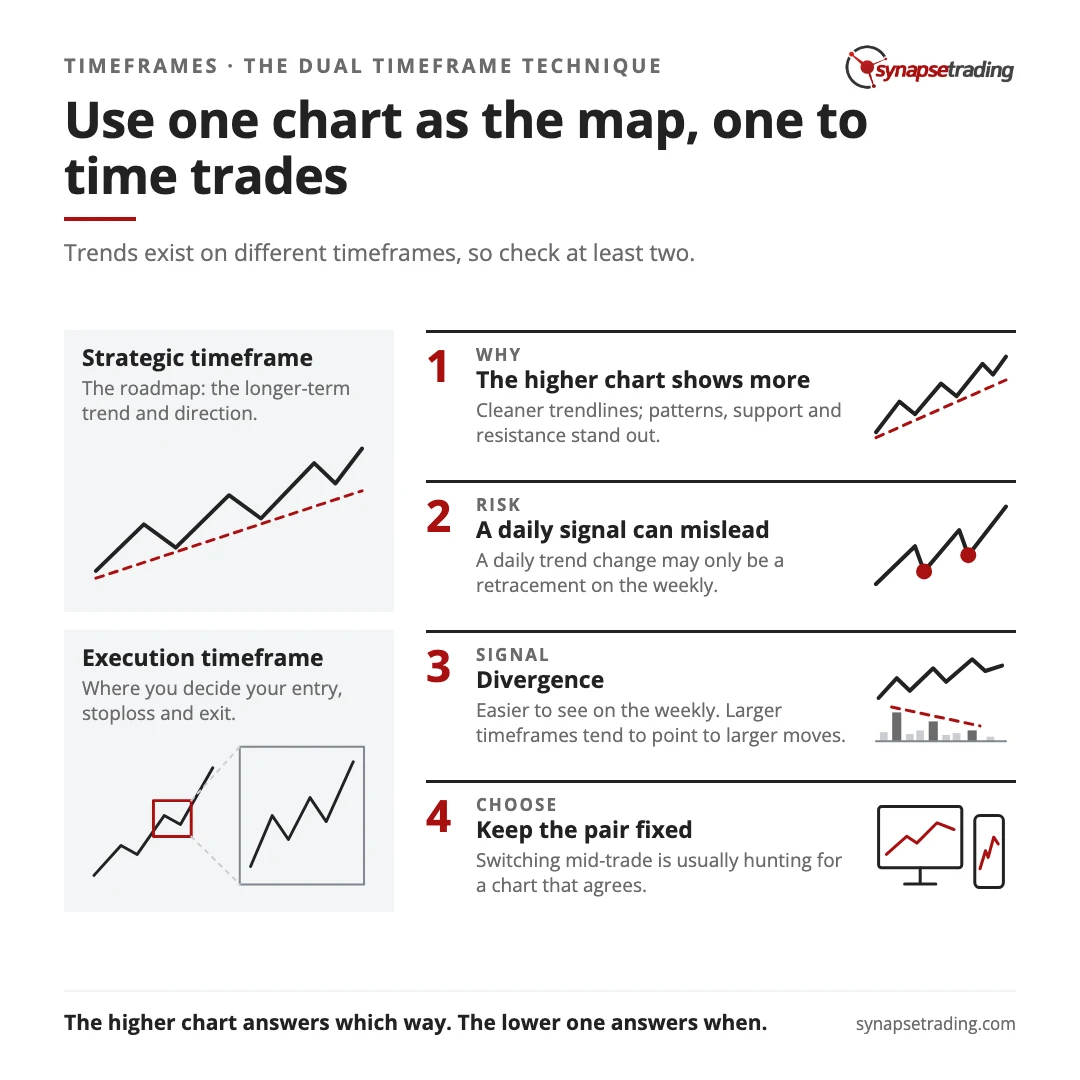
The two jobs never swap. The roadmap decides which direction you trade in, and the execution chart decides when. When a signal on the lower chart argues with the roadmap, the roadmap usually wins, because it is the larger force. Used this way, the pair also lets you manage risk in line with how long you plan to stay in the trade.
How do you choose your two timeframes?
How long do you plan to hold your next trade? That one answer decides almost everything else.
Your execution timeframe should be the chart where a typical trade of yours plays out over a sensible number of bars. Your strategic timeframe sits a clear step above it, large enough that your whole trade looks like a small part of one move. A trader who holds for weeks needs a bigger roadmap than one who is in and out within a day, and both need a roadmap that changes more slowly than the chart they trade on.
Three mistakes come up again and again.
- Too far apart. If the roadmap is so large that it barely moves in a year, it stops giving you useful direction.
- Too close together. If both charts show nearly the same thing, you have one opinion counted twice.
- Too many charts. Each extra timeframe adds another chance for disagreement, and with five charts open you can always find one that agrees with whatever you already wanted to do.
Once you have chosen, keep the pair fixed. Switching timeframes in the middle of a trade is usually a way of hunting for a chart that tells you what you want to hear. A trading journal will show you quickly whether you do this.
Does using more timeframes just add confusion?
On 30 October 2025, a trader on Reddit’s r/swingtrading asked “How to read multiple timeframes without confusing yourself”. It is a fair question, because the confusion is real. Two charts give you two opinions, and on some days they flatly disagree.
I will concede the point with my own example. In that 4 December 2025 outlook, the daily and weekly charts of USD/SGD were telling different stories. The second chart did not hand me an answer. What it did was tell me the daily signal was weaker than it looked, and my plan on the call was simply to “wait for a bit of confirmation”.
That is the honest cost of the method. A second timeframe will sometimes keep you out of a move that would have worked, and a few of those will be big ones. What it buys you is fewer trades taken against the larger trend, which over a year is usually the better deal.
The way to stop it becoming confusing is to give each chart one job and never ask it to do the other’s. The higher chart answers which way. The lower one answers when. Most of the confusion comes from asking the higher chart for timing, or the lower chart for direction.
Where to start if you are new to reading charts
Nobody learns to read two maps before they can read one. Multiple timeframe analysis assumes you can already read a single chart well, so if trends, support and resistance and candlesticks still feel new, get comfortable with those first and add the second timeframe after.
My post on trend following explains why the larger trend gets so much weight in the first place. My monthly market regime read applies the same zoom-out view to the whole US market.

If you would like to learn how to get started in trading, also check out: “The Beginner’s Guide to Trading & Technical Analysis”
Once you have the basics, you need a routine that fits around the rest of your day. The free 15-minute swing trader checklist is the one I run every day.
FAQ
What is multiple timeframe analysis?
Reading the same market on at least two timeframes before you trade. A higher one shows the main trend, and a lower one times your entry and exit.
How many timeframes should I use?
Two is enough for most traders. A third can help at times, but every extra chart adds another chance for the signals to disagree.
Which timeframe should I trade off, the higher or the lower one?
You place the trade on the lower, execution timeframe. The higher one tells you which direction to trade and how to manage the position.
What does it mean when the timeframes disagree?
Usually that the lower chart is showing a pullback or a false start inside the larger trend. Treat the higher chart as the stronger force, and consider waiting until the two line up.
Do small timeframes lead large ones?
Yes. Changes appear on small timeframes first, and the larger timeframes drive the smaller ones once they turn. That is the lead-lag relationship.
Is multiple timeframe analysis only for day traders?
No. It works for any holding period. A swing trader and a day trader simply use a different pair of charts.
For the new traders out there, how many charts do you open before you take a trade? And for the seasoned ones, which timeframe do you trust when the two disagree? Let me know in the comments.
The rest of the foundations are in my free trading guides.
And if you want a daily routine that keeps the roadmap in view without taking over your evening, grab the free 15-minute swing trader checklist.
About the author. Spencer Li is The 15-Minute Trader and the founder of Synapse Trading. He is a Certified Financial Technician (CFTe) with 15+ years of trading, run from 70+ countries. He holds a B.Acc and B.BM from SMU. Every trade he takes is public, dated, losses left in. He teaches rules-based swing trading in 15 minutes a day, one system for any market.
Education, not financial advice. Synapse Trading is not licensed by MAS to advise on investment products. Trading carries risk of loss, and past performance is not indicative of future results.
Want the daily routine? Enter your email for the free 15-Minute Swing Trader's Checklist.
Free 5-page PDF, then occasional trading emails. Education only, not financial advice. Unsubscribe anytime. Kit stores your email in the US: see our privacy policy.
Want to learn the full method? The Trading Mastery Program teaches the 4 strategies I have traded since 2011. It suits beginners and experienced traders.
Rather follow the trades as they happen? Daily Trading Signals is our Telegram channel: my trade ideas with entry, stop and exit, and every trade is public.
Questions about this post? Ask in the free Telegram channel →
Educational content only, not personalised financial advice. Trading carries risk, including loss of capital. Past performance is not indicative of future results. Synapse Trading is not licensed or regulated by MAS.


Trackbacks & Pingbacks
[…] of that trend. Often on a pullback or a break, using the daily chart to time it. Our post on combining multiple timeframes covers how the 2 charts work […]
[…] that looks random on the hourly chart can still have a clear trend on the weekly one. Our post on combining multiple timeframes shows […]
[…] structures on the same afternoon. The higher timeframe sets the direction, which is why our post on choosing the correct timeframe starts […]
Comments are closed.