

The Top 3 Economic Indicators
Want the daily routine? Get the free 15-Minute Swing Trader’s Checklist. Get it free →
In our previous videos, we’ve learned the importance of tracking the big market cycles and how fundamental and economic forces drive those movements in this video. We’re going to look at the top three economic indicators to look out for. In the past, only experienced professionals and economists received this data in a timely fashion, but in the Internet age everyone has access to dozens of economic surveys and indicators every week.
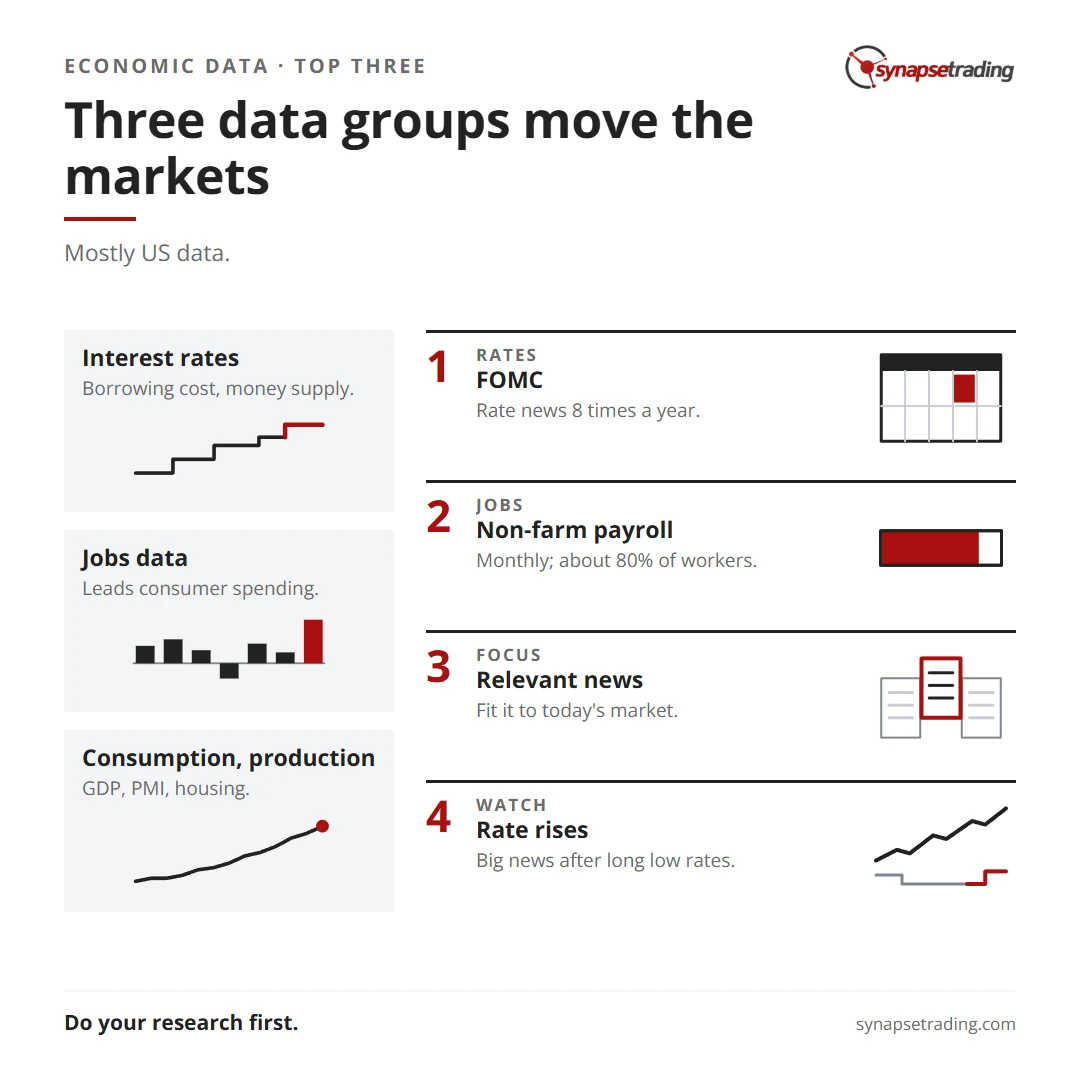
This data can be divided into three main groups: interest rate and monetary policy, employment and jobs data, and consumption and production data.
Now, keep in mind most of this data is based on the US economy since it’s the biggest financial powerhouse that moves global markets.
So, first let’s look at interest rate and monetary policy. For the US, the Federal Open Market Committee or FOMC makes scheduled announcements 8 times a year regarding interest rate or monetary policy. This can have a major impact on the markets because it affects the cost of borrowing and the money supply in the market. Other economies such as the eurozone, China, Australia, Japan and Switzerland have their own scheduled announcements where they set their interest rate and monetary policy.
Next, employment and jobs data. This data is very important because job creation is a leading indicator of consumer spending, which accounts for a majority of overall economic activity. The most important figure is the non-farm payroll which accounts for approximately 80% of the workers who produce the entire gross domestic product of the United States. This vital piece of economic data is released monthly usually on the first Friday after the month ends. The combination of importance and earliness makes for hefty market impacts. Other indicators include the Employment Cost Index (ECI), the Employment Situation report and the weekly jobless claims report.
Finally, there’s consumption and production data. There are various reports that measure different aspects of consumption and production, so it’s up to the savvy investor to piece it all together. Some examples include the Gross Domestic Product or GDP, Purchasing Managers Index or PMI, Philly Fed Report, Consumer Confidence Index, Producer Price Index, Consumer Price Index and the existing home sales report and housing starts. In general, the key is to look out for the kind of news that’s relevant to the current market climate.
For example, when the stock market has been bullish for many years and interest rates are really low, astute investors will keep their eyes peeled for any indication about interest rate increases as these will have a major impact on the market.
So remember, do your research and always make informed investment decisions.
Want the daily routine? Enter your email for the free 15-Minute Swing Trader's Checklist.
Free 5-page PDF, then occasional trading emails. Education only, not financial advice. Unsubscribe anytime. Kit stores your email in the US: see our privacy policy.
Want to learn the full method? The Trading Mastery Program teaches the 4 strategies I have traded since 2011. It suits beginners and experienced traders.
Rather follow the trades as they happen? Daily Trading Signals is our Telegram channel: my trade ideas with entry, stop and exit, and every trade is public.
Questions about this post? Ask in the free Telegram channel →
Educational content only, not personalised financial advice. Trading carries risk, including loss of capital. Past performance is not indicative of future results. Synapse Trading is not licensed or regulated by MAS.

