• Link to Facebook
  • Link to X
  • Link to Instagram
  • Link to Youtube
  • Link to LinkedIn
  • Link to Mail
Free PDF: The 15-Minute Swing Trader's Checklist, the daily routine of a trader since 2007
Synapse Trading
  • Mentoring
    • Trading Mastery Program
    • All mentoring options
  • Signals
    • Daily trading signals
    • Signals trade log
  • Results
    • Student results and testimonials
    • Public trade log, losses left in
  • Free guides
    • Start here
    • Trading foundations
    • Technical analysis
    • Strategies and systems
    • Risk and money
    • Trading psychology
    • Markets and products
    • Free trading guides
    • Tools and resources
    • Blog
  • About
    • My background
    • My trading journey
    • Media and interviews
    • Travel log
  • Contact
    • Contact me
    • Partnerships
  • Start free
  • Click to open the search input field Click to open the search input field Search
  • Menu Menu
Spencer Li

How to Backtest a Trading Strategy: Six Steps, and the Numbers That Tell You It Is Real

Trading Strategies & Systems
Backtest a strategy properly - trading strategies

Most backtests flatter the strategy. Here is how to run one that can tell you no

Published: 17 October 2026 · Last updated: 28 August 2026 · By Spencer Li, CFTe


A swing trader who traded Singapore stocks had a strategy that worked. Over 3 years of testing it showed +14%, and the live trades were winning about half the time. Then, as the trader wrote in a Reddit post this year, “Then I ran the full 10-year backtest on ~600 SGX stocks with real costs.” The result was −78.9%. Brutal. The trader’s verdict: “The edge never existed.”

That is what a backtest is for. It is a way to find out a strategy does not work before the market charges you to find out.

So how do you backtest a trading strategy properly? Write the rules down so a stranger could follow them. Test them on enough data, with real costs. Read profit factor, expectancy and drawdown instead of total return. Hold some data back that you never look at until the end. Then trade it small before you trust it. The six steps below go through each one.
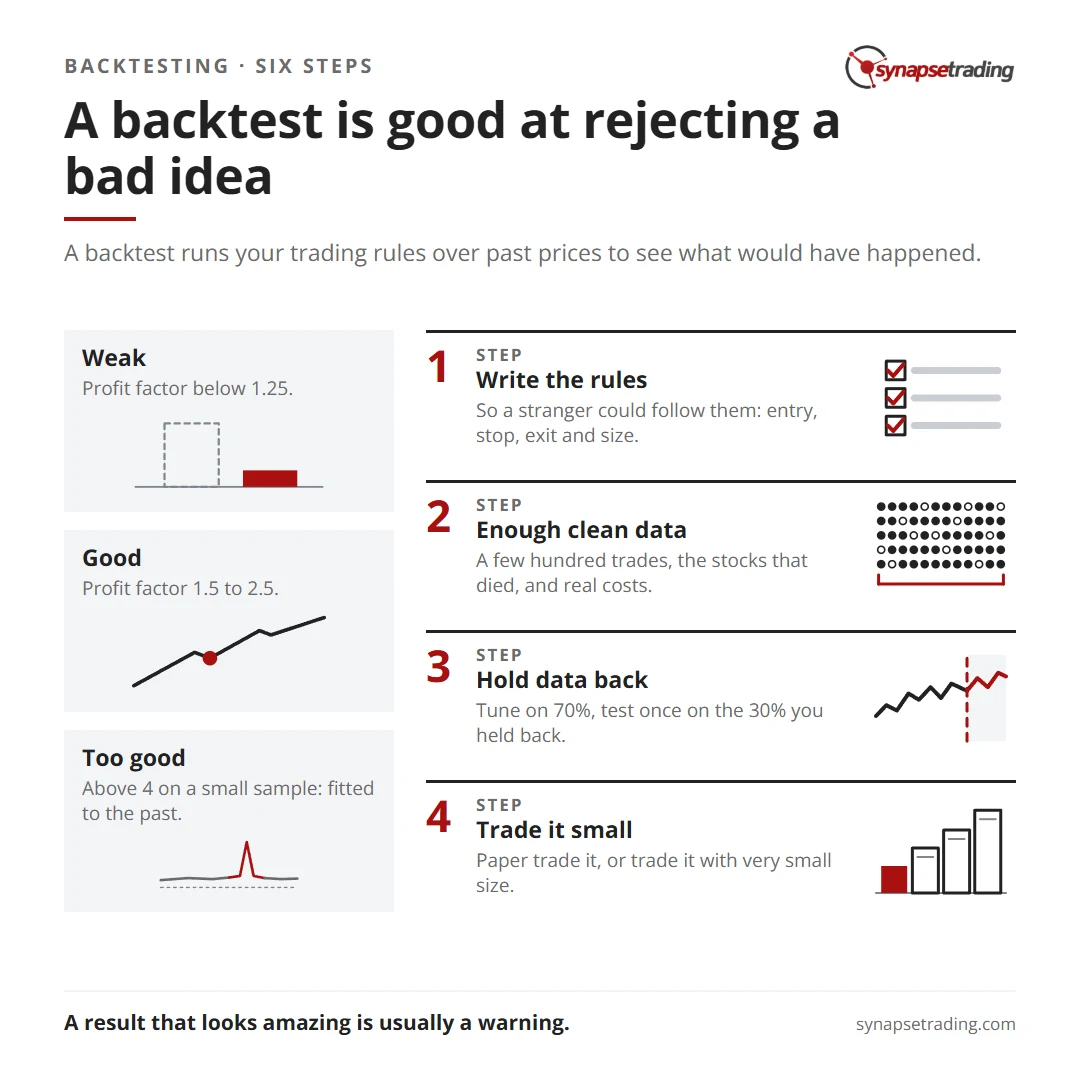
A backtest is good at rejecting a bad idea. Summary card for the post: How to Backtest a Trading Strategy: Six Steps, and the Numbers That Tell You It Is Real.

What is a backtest, and what can it actually tell you?

A backtest runs your trading rules over past prices to see what would have happened. Think of it as a driving test on a simulator. Passing it does not make you a good driver. Failing it tells you clearly that you are not ready for the road.

That is the right way to think about every result you get. A backtest is very good at rejecting a bad idea and quite poor at predicting how much a good one will make.

How do you backtest a trading strategy, step by step?

Step 1: write the rules so a stranger could follow them. Entry, stop, exit and position size, all in plain words with numbers. “Buy strong stocks on a dip” cannot be tested. “Buy when price closes above the 20-day average after a 3-day pullback, with the stop below the pullback low” can.

Step 2: get enough clean data. Two things matter here. You need enough trades, and you need the stocks that died. A test that only uses stocks still listed today quietly leaves out every company that went bust, so it measures only the survivors. That is called survivorship bias, and it makes almost every strategy look better than it is.

Step 3: charge real costs. Commission, the bid-ask spread, and slippage on your stops. The SGX trader above named fake costs as one of his four traps. On a short-term strategy with a tight stop, costs can be the difference between a small edge and a steady loss.

Step 4: read the right numbers. Total return tells you very little on its own. The numbers that matter are in the table further down.

Step 5: hold data back. Build and tune the strategy on about 70% of your history. Then test it once on the 30% you never touched. If it falls apart there, it was fitted to the past.
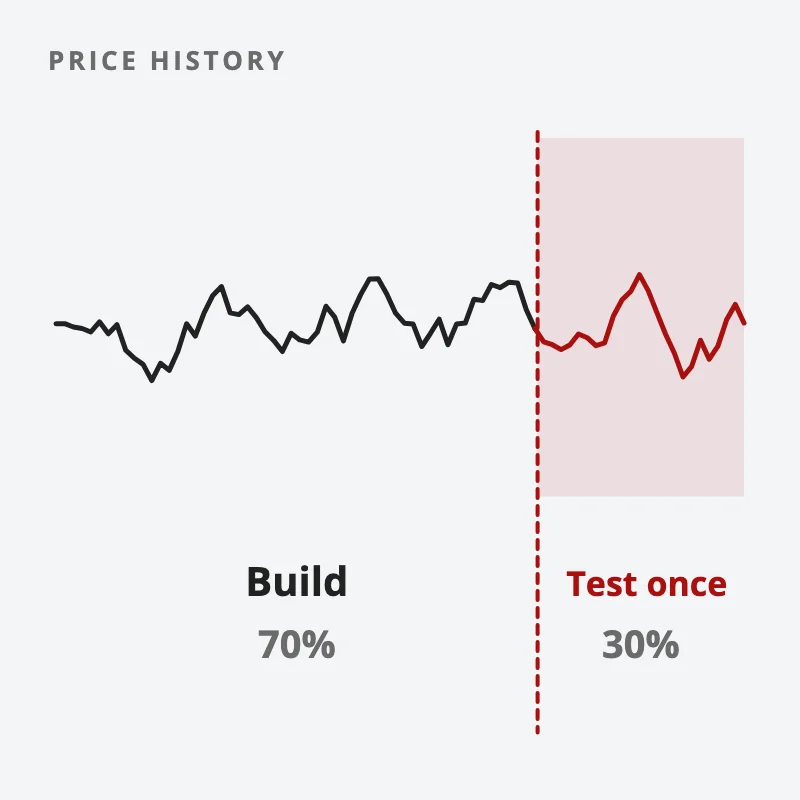
One price history split in two: build and tune the strategy on the first 70%, then test it once on the last 30%, held back until the end
Build and tune on 70% of your history, then test once on the 30% you held back.

Step 6: forward test, then trade it small. Paper trade it on new data, or trade it with very small size. This is the only test where the future is truly unknown. Paper trading alternatives covers the ways to do this without risking much.

Can you backtest a strategy in TradingView?

Yes, for a quick first look. TradingView’s Strategy Tester is fast and free to start, which makes it a good place to prototype an idea. Do note its limits. It tests one symbol at a time, and how much history you get depends on your plan.

So a TradingView result on one stock is step 1 of the job. For a test across a whole market, over many years, with the dead stocks included, you need a coding tool such as Python and a data set that keeps delisted stocks.

How many years of data do you need for a backtest?

Enough to get a few hundred trades through more than one kind of market. A trader on Reddit argued the opposite: “backtest 1-2 years, more will hinder you.” That comment got 384 upvotes, and the appeal is easy to see, because recent data feels more relevant.

But look at the SGX trader again. The 3-year window said +14%. The 10-year test said −78.9%. The short window happened to catch a market that suited the strategy, which is the “window luck” the trader named as the first trap.

Short tests have a second problem. With only 40 trades, a strategy with no edge at all can show a great result by pure chance, in the same way that a coin can land heads 7 times in 10 without being a loaded coin. The law of large numbers explains why you need a few hundred before the average means much.

If you want a routine that keeps you testing one rule at a time instead of chasing the next idea, our free 15-Minute Swing Trader’s Checklist is a good place to start. Get the free checklist →

Which backtest numbers actually matter?

Here are the numbers worth checking, with rough bands. They are a guide, and the right numbers depend on the market and the style.

NumberWeakGoodToo good to be true
Profit factor (gross wins ÷ gross losses)Below 1.251.5 to 2.5Above 4, on a small sample
Sharpe ratio, yearlyBelow 0.51 to 2Above 3
Worst drawdownAbove 30%10% to 20%Below 5% on few trades
ExpectancyBelow 0RClearly above 0R, on hundreds of tradesA large figure on a few dozen trades

Notice the last column. A result that looks amazing is usually a warning. It most often means the rules were tuned until they fit the past, or the test is too short, or the costs are missing.

Expectancy is the one to learn first. It is the average result per trade, measured in R, where 1R is what you risk. A strategy that wins 45% of the time, with average wins of 2R and average losses of 1R, has an expectancy of 0.35R a trade. The trading expectancy formula works through it, and trading performance metrics covers the rest.

One more check takes 5 minutes and catches a lot. Nudge each setting a little, say a 20-day average to 18 and 22. A real edge sits on a plateau, so the results barely move. A fitted one sits on a spike, so they fall apart.

What does an honest backtest look like?

It has a pass mark written down before any code runs. Say how many trades the test must produce, how far above zero the edge must sit once you allow for chance, and how many of the years tested must be positive.

Then run the test once and hold the result to that mark. If it misses any bar, it fails, even when the average looks good. Keep the most recent stretch of data untouched, so the next idea still has a clean test waiting for it.

That is the part most people skip. Writing the pass mark down first stops you moving the goalposts, because once you see a result you like, it is easy to decide a smaller sample is plenty and a weaker year count is close enough.

In what order should you trust a backtest result?

From weakest to strongest, the order runs like this. Each rung costs more work and gives you more truth.

  1. A single backtest. One run on one data set. Good for throwing out bad ideas.
  2. In-sample and out-of-sample. Tune on 70%, test once on the 30% you held back.
  3. Walk-forward. Repeat that split many times, moving forward through history.
  4. Monte Carlo. Shuffle the trade order thousands of times to see the range of drawdowns you could have hit.
  5. Paper trading. Run it live on new data with no money.
  6. Small live money. Real fills, real emotions, small size.

A fair rule of thumb: anything below rung 2 is still an idea, and anything below rung 5 is unproven. Aronson made the same case at book length, and our review of Evidence-Based Technical Analysis sums up his argument.

So where does your current strategy sit on the ladder? And did you write down what would count as a fail before you looked at the results? If the honest answer is “rung 1” and “no”, that is your next weekend’s work. For the bigger picture, see the guide to trading strategies, and if you wonder whether a good run is real at all, read is trading skill or luck.

FAQ

How do you backtest a trading strategy?

Write the rules so anyone could follow them, run them over enough past data with real costs, and read profit factor, expectancy and drawdown. Then test once on data you held back, and forward test before you trust it.

Can I backtest for free?

Yes. TradingView’s Strategy Tester and a spreadsheet are enough for a first test on one market. A test across many stocks with delisted names included usually needs paid data.

How many trades do you need for a reliable backtest?

A few hundred is a sensible floor. Below about 100 trades, luck can easily produce a result that looks like an edge.

What is a good profit factor in a backtest?

Roughly 1.5 to 2.5. Below 1.25 is weak, and above 4 on a small sample usually means the strategy was fitted to the past.

Why does my strategy work in a backtest but fail live?

The usual reasons are missing costs, a test window that suited the strategy, settings tuned to past noise, and too few trades. An out-of-sample test and a small live run catch most of these.

Go deeper

A backtest only helps if you then follow the rules you tested. The free 15-Minute Swing Trader’s Checklist has the daily routine, the questions to ask before every trade, and the five rules that protect your account.


About the author. Spencer Li is The 15-Minute Trader and the founder of Synapse Trading. He is a Certified Financial Technician (CFTe) with 15+ years of trading, run from 70+ countries. He holds a B.Acc and B.BM from SMU. Every trade he takes is public, dated, losses left in. He teaches low-risk swing trading in 15 minutes a day, one system for any market.

Educational content only, not personalised financial advice. Trading carries risk, including loss of capital. Past performance is not indicative of future results. Synapse Trading is not licensed or regulated by MAS.

by Spencer Li
https://synapsetrading.com/wp-content/uploads/2026/10/how-to-backtest-trading-strategy-card.webp 630 1200 Spencer Li https://synapsetrading.com/wp-content/uploads/2026/10/synapse-logo-horizontal-light.png Spencer Li2026-04-10 19:49:002026-08-28 10:04:39How to Backtest a Trading Strategy: Six Steps, and the Numbers That Tell You It Is Real
The Synapse Network

Using Technical Indicators to Develop Trading Strategies

Trading Strategies & Systems
Build strategies from indicators - indicators

Indicators, such as moving averages and Bollinger Bands®, are technical analysis tools used by traders and investors to analyze past price trends and anticipate future price patterns.

Fundamentalists focus on economic data or corporate profitability, while technical traders rely on charts and indicators to interpret price moves.

The primary goal of using indicators is to identify trading opportunities.

For example, a moving average crossover can signal an upcoming trend change.

Applying an indicator to a price chart allows traders to spot where the trend may weaken or reverse, creating potential trading setups.

Technical strategies typically use indicators to define specific rules for entry, exit, and trade management.

These strategies often combine multiple indicators to pinpoint the best times to trade and establish objective decision-making rules.

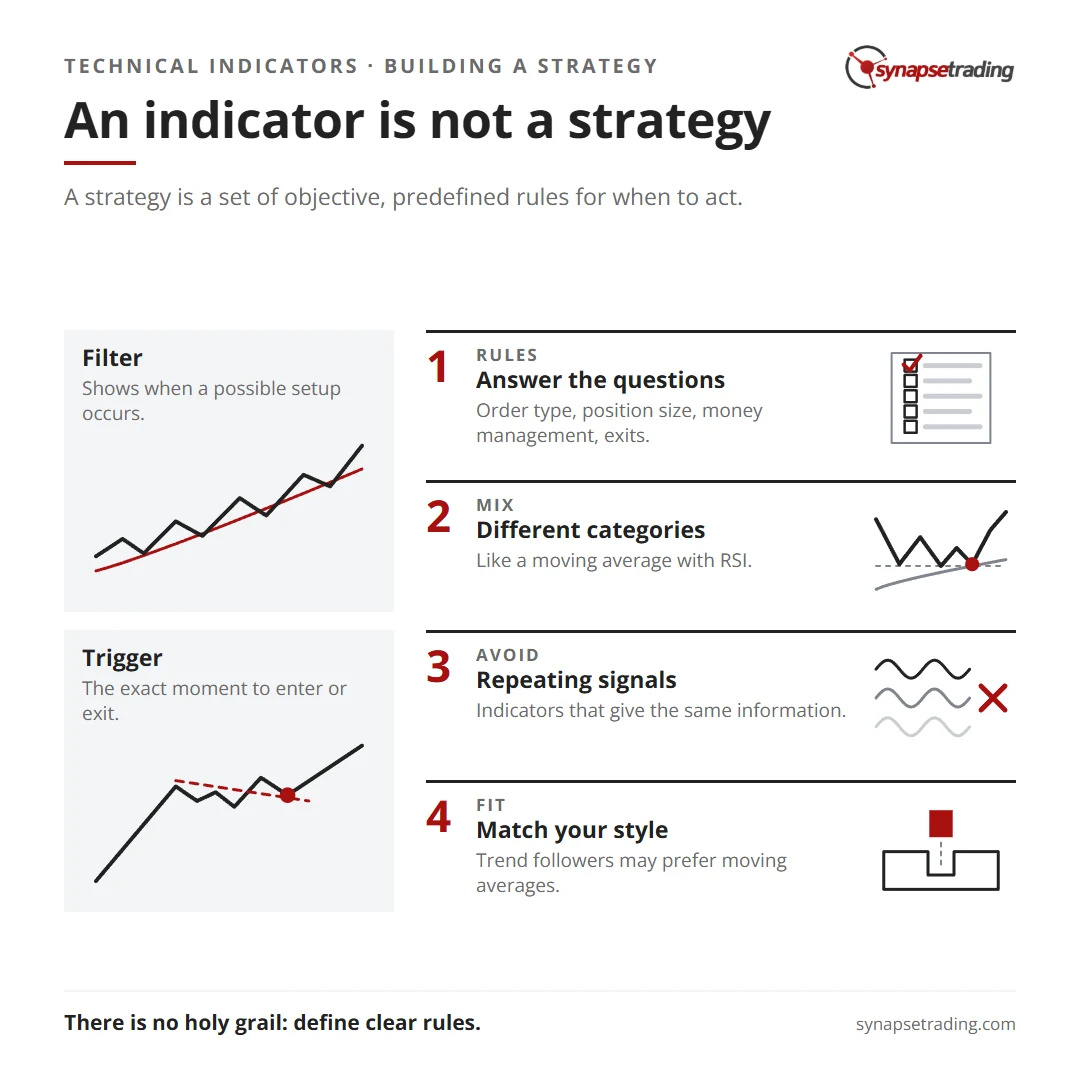
An indicator is not a strategy. Summary card for the post: Using Technical Indicators to Develop Trading Strategies.

Indicators

There are various technical indicators available for traders, including widely used tools like moving averages or stochastic oscillators.

Some indicators are publicly available, while others are proprietary, developed by traders or programmers.

Most indicators have user-defined variables, such as the “look-back period,” which allows customization based on the trader’s needs.

For instance, a moving average might calculate a stock’s price over a specific period, such as 50 or 200 days.

The length and price points used in the calculation can be adjusted by the user to fit their trading style.

Strategies

A strategy is a set of objective, predefined rules for when a trader will take action.

It includes trade filters and triggers, often based on technical indicators.

A trade filter identifies when a potential setup occurs, while the trade trigger defines the exact moment to enter or exit a trade.

For example, if a stock closes above its 200-day moving average, this could set the stage for a trade trigger if the stock rises one tick above the high of the bar that broke the moving average.

A well-defined strategy addresses critical questions, such as:

  • What type of moving average will be used?
  • How far above the moving average should the price move to trigger a trade?
  • What kind of order will be placed?
  • How will position size be determined?
  • What are the money management and exit rules?

Without answering these questions, strategies may be too simplistic and not actionable.

Using Technical Indicators

Indicators themselves are not strategies.

While they help traders identify market conditions, a strategy outlines specific actions to take.

Combining multiple indicators from different categories—such as momentum, trend, or volume indicators—can improve a strategy’s reliability.

For example, using a moving average in conjunction with a momentum indicator like the Relative Strength Index (RSI) might confirm the validity of a signal.

By employing indicators from different categories, traders avoid multicollinearity, where multiple indicators provide the same information, leading to redundant or misleading signals.

Choosing Indicators to Develop a Strategy

The choice of indicators depends on the type of strategy a trader wants to develop.

A trend-following trader may prefer using trend indicators like moving averages, while a trader looking for frequent small gains might opt for volatility-based indicators.

Traders can also purchase black-box systems that have already been researched and backtested, but these proprietary systems typically don’t disclose the underlying methodology, limiting the trader’s ability to customize the strategy.

Concluding Thoughts

While indicators are essential tools in technical analysis, they do not create trading signals on their own.

Traders need to define clear rules for how indicators will be used in a strategy, ensuring objective decision-making for when to enter and exit trades.

There is no “holy grail” strategy that guarantees success.

Each trader must develop their approach based on their unique style, risk tolerance, and understanding of the markets.

By learning about different technical analysis tools, traders can refine their strategies to improve their trading performance.

by The Synapse Network
https://synapsetrading.com/wp-content/uploads/2026/10/using-technical-indicators-to-develop-trading-strategies-card.webp 630 1200 The Synapse Network https://synapsetrading.com/wp-content/uploads/2026/10/synapse-logo-horizontal-light.png The Synapse Network2023-09-20 00:51:252026-09-29 07:37:07Using Technical Indicators to Develop Trading Strategies
The Synapse Network

Moving Average Crossover Strategies

Trading Strategies & Systems
Moving average crossover strategies - trading strategies

Moving averages are often the first technical indicator traders will utilize when they set out to understand trading. However, even highly competent traders who have knowledge of many advanced tools often continue to rely on moving averages, highlighting their significance in technical analysis.

These averages play a critical role across the trading spectrum, providing insights into market trends and potential turning points.
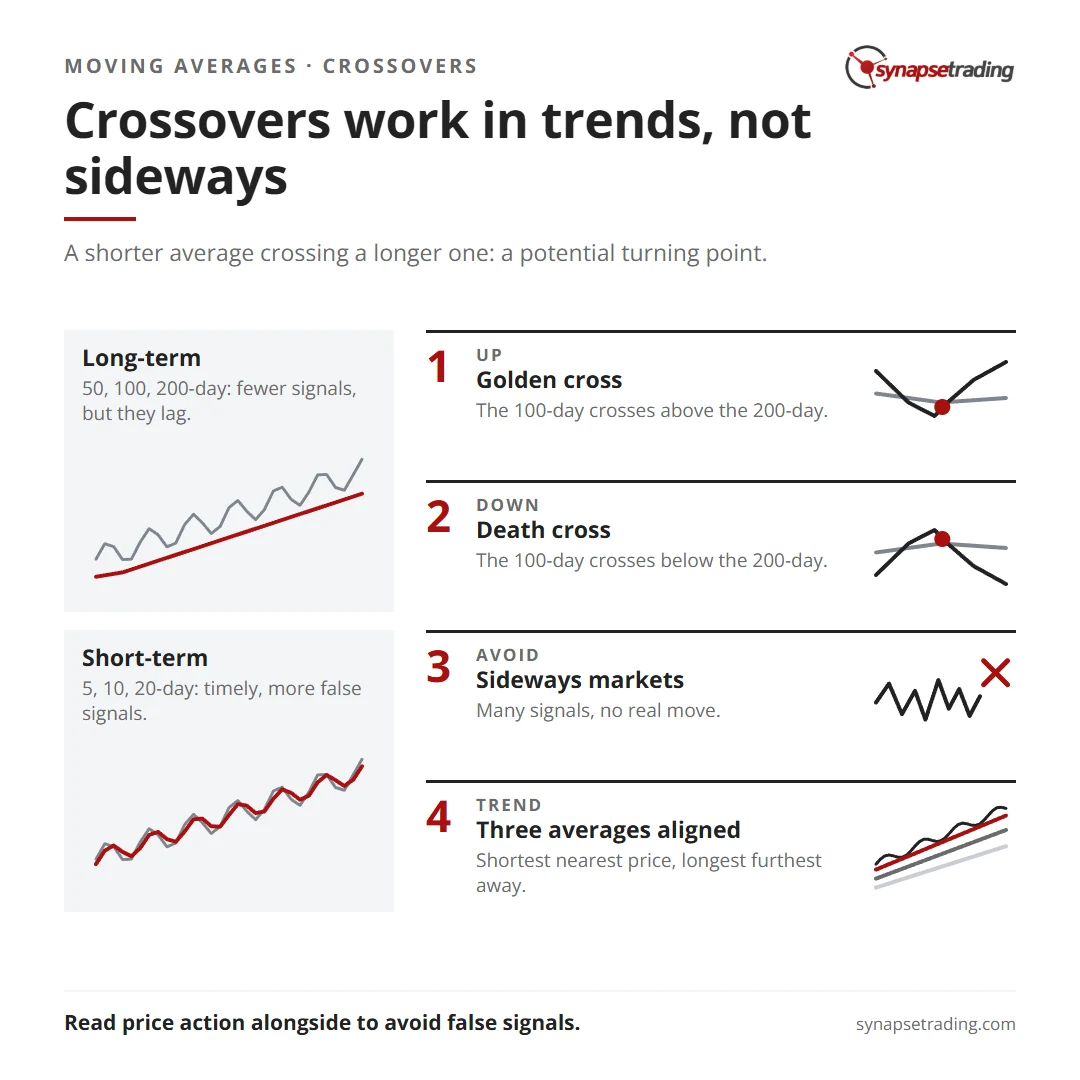
Crossovers work in trends, not sideways. Summary card for the post: Moving Average Crossover Strategies.

Types of Moving Average Crossovers

Moving averages can be used in various ways, such as providing support and resistance levels, or indicating potential turning points through crossovers. Each trader may have their preferred averages, but it is useful to categorize them into two groups: long-term and short-term.

Long-Term Moving Averages

Long-term moving averages, such as the 50, 100, and 200-day averages, are slower moving and provide less sensitivity to short-term price action.

These averages typically offer fewer signals, but the rarity of these signals can enhance their perceived importance. Due to their slower nature, long-term averages carry the risk of producing lagging signals, meaning they may confirm trends or reversals after they have already begun.

Short-Term Moving Averages

Conversely, short-term moving averages, like the 5, 10, 20, and 50-day averages, offer more reactive indicators, providing traders with timely signals based on recent price action.

These averages generate more frequent signals, which can be beneficial for active trading. However, this increased frequency can also lead to a higher number of false signals, making them more susceptible to market noise.

When employing a moving average crossover strategy, the key is to use the shorter, more reactive average as an indicator of potential market direction.

Crossover strategies are typically more effective in trending markets, where sideways trading tends to produce numerous buy and sell signals without substantial results.

Golden Cross and Death Cross

Long-term moving average crossovers can often be labeled as ‘golden crosses’ or ‘death crosses’ depending on their bullish or bearish implications.

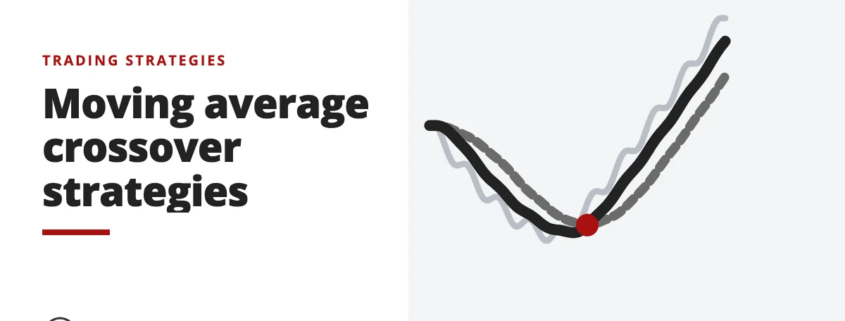
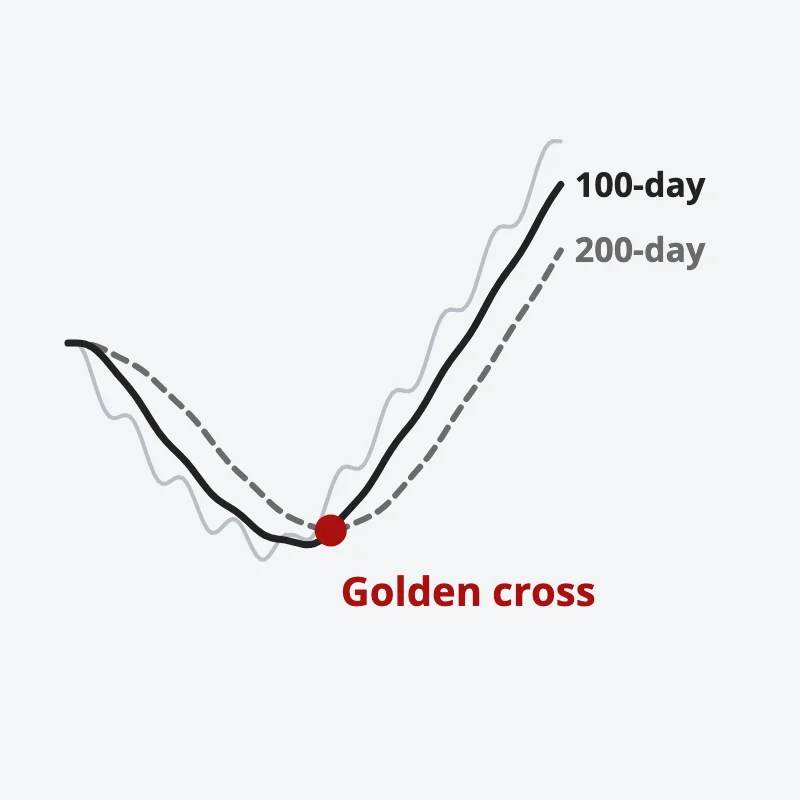
For example, in a 100-day and 200-day simple moving average (SMA) strategy, a ‘golden cross’ occurs when the 100-day SMA crosses above the 200-day SMA, signaling a bullish trend. Conversely, a ‘death cross’ occurs when the 100-day SMA crosses below the 200-day SMA, indicating a bearish trend.

Price falls then turns up; the 100-day moving average crosses above the 200-day, marked in red as a golden cross
A golden cross is when the 100-day SMA crosses above the 200-day SMA.

These long-term crossovers can illustrate both the strengths and weaknesses of a longer-term SMA crossover strategy. For instance, on a USD/CNH chart, a death cross might indicate a sell signal when the shorter SMA crosses below the longer SMA, potentially marking the start of a significant downtrend.

However, the lagging nature of these signals means that by the time the crossover occurs, much of the price movement may have already happened, reducing the effectiveness of the signal.

Short-Timeframe Crossover Signals

Shorter-term moving average strategies, such as the 10-day and 20-day SMA crossover, provide a different trading experience. These moving averages track price action more closely, resulting in a higher number of signals.

While this can be advantageous in trending markets, it often leads to a greater number of false signals in sideways markets. The key to success with short-term crossovers lies in distinguishing between trending and consolidating market phases.

By analyzing price action alongside the moving averages, traders can better identify when a trend is truly beginning or ending, thus avoiding false signals.

Alternate Forms of Moving Averages

Not all moving averages are created equal. While the simple moving average (SMA) is commonly used, other types of moving averages, such as the exponential moving average (EMA), offer different insights.

The EMA, for example, gives more weight to recent prices, making it more responsive to current market conditions. This responsiveness can provide more timely signals compared to the SMA, particularly in fast-moving markets.

Three Moving Average Strategy

A strategy that incorporates multiple moving averages can provide a balanced approach by combining short-term and long-term elements.

For example, using a triple EMA strategy, where short, medium, and long-term EMAs are analyzed together, can help traders identify trending markets.

In a strong trend, these EMAs will align in sequence, with the shortest EMA closest to the price and the longest EMA furthest away.

Incorporating price action analysis with this strategy can further enhance its effectiveness by confirming whether the market is trending or consolidating.

Concluding Thoughts

Moving averages, whether simple, weighted, or exponential, remain a cornerstone of technical analysis for traders of all levels.

Their ability to smooth out price data and reveal trends makes them invaluable tools in identifying support and resistance levels, trend direction, and potential reversal points.

By understanding the strengths and weaknesses of different moving averages and their crossover strategies, traders can develop more effective trading strategies, whether they are focusing on short-term or long-term market movements.

by The Synapse Network
https://synapsetrading.com/wp-content/uploads/2026/10/moving-average-crossover-strategies-card.webp 630 1200 The Synapse Network https://synapsetrading.com/wp-content/uploads/2026/10/synapse-logo-horizontal-light.png The Synapse Network2023-09-03 15:58:262026-09-19 12:19:54Moving Average Crossover Strategies
The Synapse Network

Best Strategies for Trading Candlestick Patterns

Trading Strategies & Systems
Best ways to trade candlesticks - candlestick patterns

Trading price action through candlestick patterns is one of the most effective methods for identifying market opportunities.

Candlesticks visually represent price movements and provide traders with essential data at a glance.

Trading strategies based on candlesticks involve identifying high-probability patterns for market entry and managing trades according to pre-established rules that align with your money management strategy.

Japanese rice traders developed the candlestick by incorporating open, high, low, and closing prices, leading to the identification of numerous patterns that offer high-probability trading opportunities.

These patterns vary in size and shape, from single-period candlesticks like pin bars to multi-bar patterns like the Three White Soldiers.

However, not all patterns deliver the best win rates in trading.

We have identified eight major candlestick patterns that consistently work.

Let’s explore how you can benefit from these patterns and develop trading strategies around them.
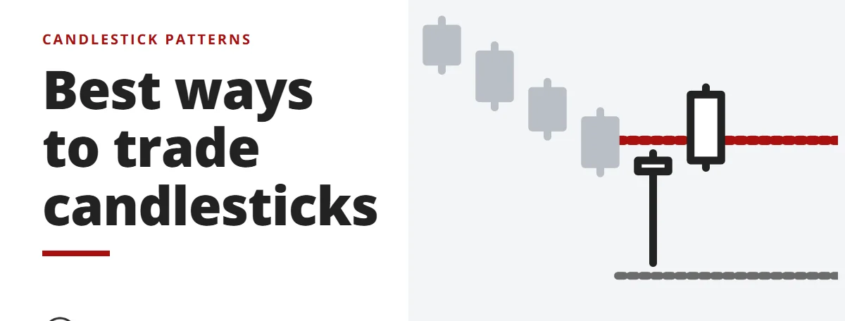
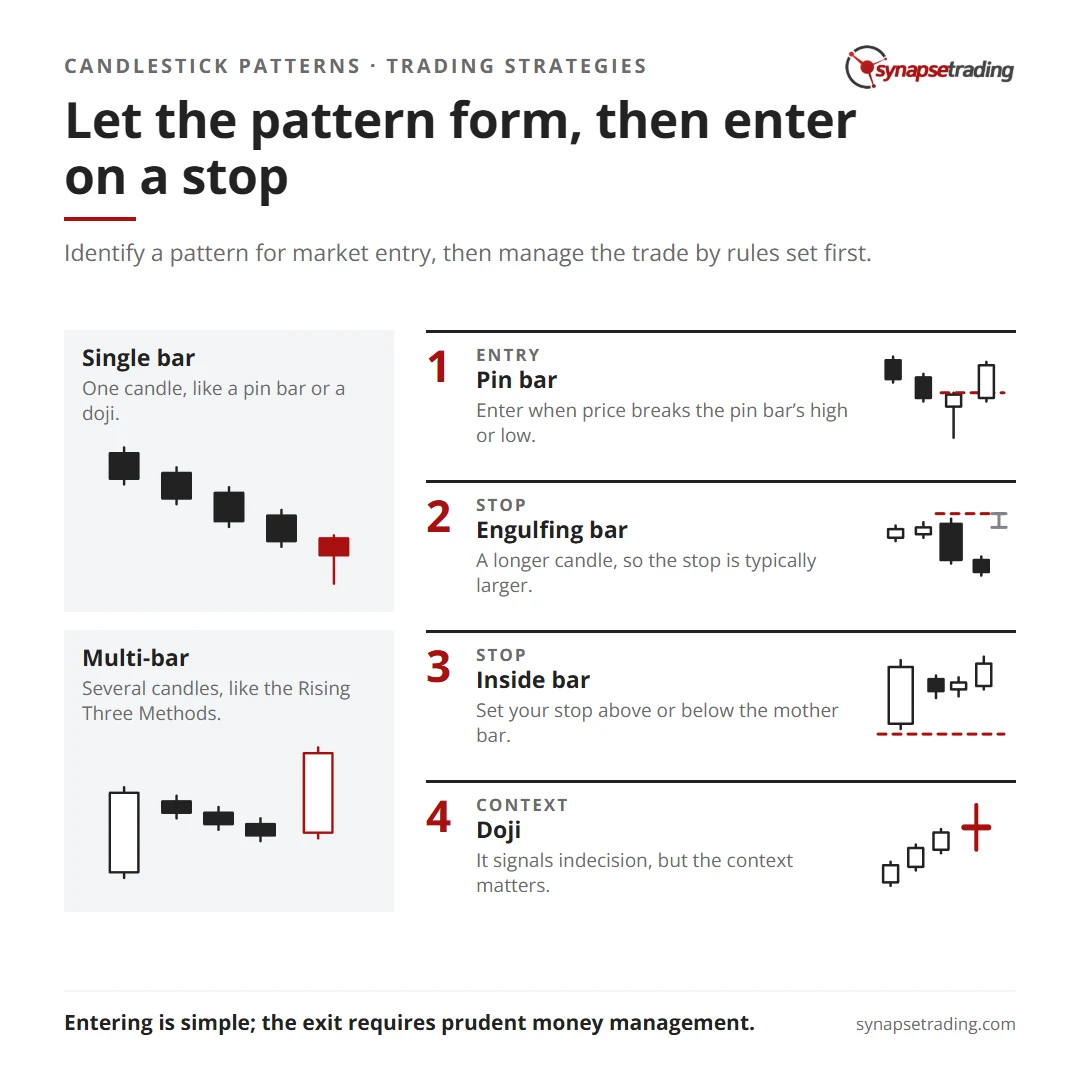
Let the pattern form, then enter on a stop. Summary card for the post: Best Strategies for Trading Candlestick Patterns.

#1: Pin Bar Reversal Patterns

Pin bars are highly effective for trading candlesticks as they often create high-probability price action setups.

A pin bar forms when the price moves up or down during a single period, but the closing price remains within the previous bar’s range.

In the example below, we identify two pin bars, one bullish and one bearish.

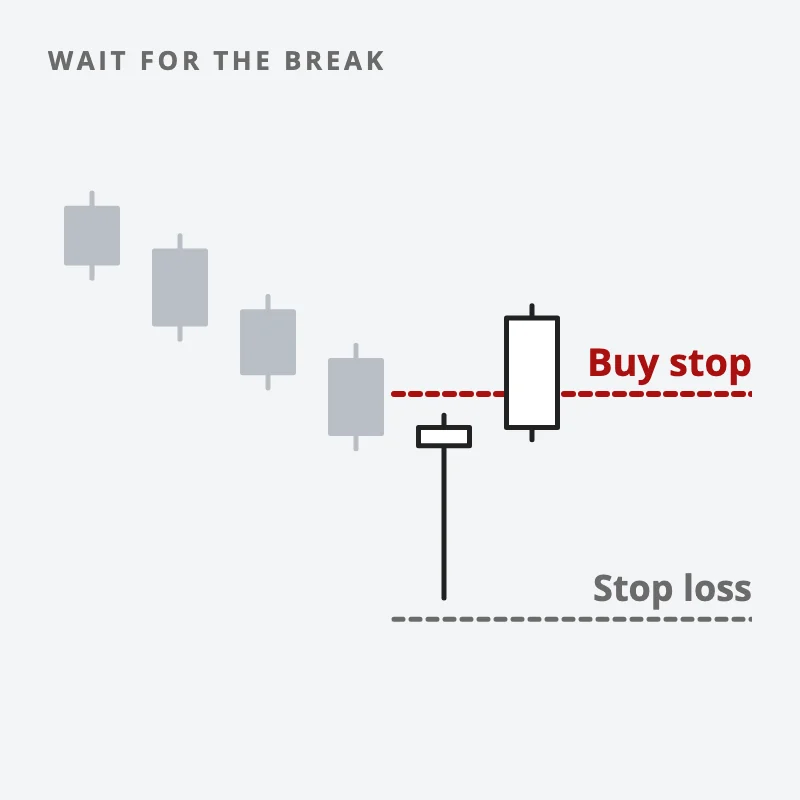
To trade pin bars, wait for the price to break above or below the high or low, respectively, and enter the market at that point.

Pinbar setups are triggered when the next candlestick’s price breaks above the body of the pin bar.

After your order is triggered, you can look for the next support and resistance levels to find your primary profit target.

If you’re a short-term trader, you can aim for a reward-to-risk ratio of 3:1 or another ratio that suits your strategy.

If pin bars form at the extreme high or low of a sustained trend, it could signal a complete reversal of the prevailing trend.

In such cases, trailing your open position based on ATR or X-bar stop losses could maximize your long-term profit.

#2: Bullish and Bearish Engulfing Patterns

Bullish and bearish engulfing candlestick patterns, like pin bars, signal a trend reversal.

In Western trading, these patterns are known as Bullish Outside Bars (BUOB) and Bearish Outside Bars (BEOB).

An outside bar has higher highs and higher lows than the previous bar.

If the closing price is lower than the opening price, it’s a BEOB; if higher, it’s a BUOB.

In the example below, a large bearish candlestick engulfs a smaller bullish candlestick, creating a BEOB.

Placing a sell stop order a few pips below the BEOB’s low and targeting the next pivot zone could result in a winning trade with a decent reward-to-risk ratio.

Engulfing patterns are best used at the top or bottom of a trend for reversal signals, but they can also be effective in range-bound markets.

Engulfing candlesticks often break above or below a range, offering breakout trading opportunities.

Due to the longer size of engulfing candles compared to pin bars, the required stop loss is typically larger.

One way to mitigate this is by drawing Fibonacci retracements based on the engulfing bar’s high and low and setting a stop loss at a specific Fibonacci level.

#3: Inside Bars for Reversals and Continuations

Inside bars are unique in that they can signal both trend reversal and trend continuation, depending on where they form on the chart.

An inside bar is the opposite of an engulfing bar, with its high and low shorter than the previous bar’s, forming within the larger bar’s range.

To trade inside bars, wait for the price to break above or below the previous (longer) bar’s high or low.

In the example below, after a large bullish bar, two smaller bars formed within the previous bar’s high and low.

Inside bars like these can range from a single bar to several, and they remain valid as long as they don’t cross the larger bar’s high or low.

When the price breaks above the larger bar (mother bar), it signals the start of a momentum trade, often leading to a trend continuation.

If you find inside bar patterns during a strong trend, they may also signal trend continuation.

In either case, set your stop loss above or below the mother bar.

For traders needing a smaller stop loss, setting it above or below the range of inside bars is an option, though riskier and not recommended for beginners.

#4: Doji Bars Signal Indecision

A Doji forms when the opening and closing prices are nearly identical.

Officially, both prices must be the same, but a difference of a pip or two is acceptable.

Several variants of Doji exist based on how the price moved before reversing.

For example, if the high and low are equally distant from the open and close, it’s called a Star Doji.

If the price moves up and down but closes at the opening price, it forms a Gravestone or Dragonfly Doji, indicating bearish or bullish signals, respectively.

A Doji formation signals market indecision, but the context matters.

If a Doji forms during a strong trend, it may signal continuation if the price breaks above or below the Doji.

In the example below, a Doji forms during an uptrend, signaling temporary equilibrium in the market.

As soon as the price breaks above the Doji, the uptrend continues.

Placing a buy stop order a few pips above the Doji allows you to increase your long exposure or enter the market for the first time.

Given that Doji bars are typically small, setting a tight stop loss can maximize your reward-to-risk ratio.

#5: Three Bar Reversal Patterns

Three-bar patterns are among the easiest candlestick patterns to identify.

They include the Three White Soldiers (bullish reversal) and Three Black Crows (bearish reversal).

As the name suggests, when three consecutive bullish or bearish bars form at the top or bottom of a sustained trend, they signal a reversal.

In the example below, three bearish bars form at the top of an uptrend, signaling a reversal.

While the first bearish bar’s high wasn’t the highest peak, this is acceptable.

As long as the three bars form near the top of a bullish trend, it’s considered a Three Black Crows pattern.

Once the price breaks below the lowest bearish bar, the downtrend continues.

Sometimes, after the low is broken, the price may retrace slightly, but that’s normal.

Set your stop loss above the highest Crow.

The same principle applies to Three White Soldiers, a bullish signal pattern.

#6: Hanging Man Signals Bearish Reversal

A Hanging Man pattern forms when a large bearish movement occurs, but the price closes near the opening price, leaving a long shadow twice the size of the candle’s body.

The Hanging Man resembles a bullish pin bar but forms at the top of an uptrend, often with a gap.

However, the pattern is still valid without a gap.

The Hanging Man pattern is always a bearish signal.

A similar pattern at the bottom of a downtrend, called a Hammer, signals bullishness.

In the example below, a Hanging Man forms, and as soon as the low of the bar is broken, a bearish trend ensues.

Set your stop loss just above the high of the Hanging Man.

#7: Rising and Falling Three Methods

The Rising and Falling Three Methods candlestick patterns are more complex.

The Rising Three Method pattern features a large bullish candle followed by three smaller bearish candles that stay above the first candle’s low.

A fifth bullish candle then engulfs the three bearish candles and closes above the first candle’s high.

In the example below, a large bullish candle is followed by three smaller bearish ones.

The fifth bullish candle engulfs the three bearish candles and closes above the high of the first candle, completing the Rising Three Method pattern.

To trade these patterns, wait for the fifth candle to close and then enter with a market order.

Aggressive traders may set a stop loss below the third bearish bar’s low, while conservative traders may place it below the first bullish candle’s low.

The same approach applies to the Falling Three Method pattern on the opposite side.

#8: Harami Cross as a Reversal Signal

The Harami Cross pattern consists of a bullish or bearish candle at the trend’s top or bottom, followed by a Doji that forms within the previous candle’s range.

If a bullish candle is followed by a Doji, expect a bearish retracement soon.

In the example below, a Harami Cross forms at the top of a bullish trend.

Wait for the price to break below the bullish candle’s low and place a Sell Stop order a few pips below it.

Concluding Thoughts

Candlestick pattern-based strategies are straightforward to implement, as they often require waiting for the pattern to form and placing a buy or sell stop order.

This approach allows you to enter the market when the trade confirmation occurs.

A falling market, then a pin bar; a red dashed buy stop sits just above its high and a grey dashed stop loss below its low, and the next candle breaks up through the buy stop
Let the pattern form first and enter with a stop order when price breaks its high.

While entering the market using the discussed candlestick strategies is simple, successful implementation requires prudent money management and strategic decision-making regarding when and how to exit.

by The Synapse Network
https://synapsetrading.com/wp-content/uploads/2026/10/best-strategies-for-trading-candlestick-patterns-card.webp 630 1200 The Synapse Network https://synapsetrading.com/wp-content/uploads/2026/10/synapse-logo-horizontal-light.png The Synapse Network2023-08-11 06:08:352026-08-22 09:35:50Best Strategies for Trading Candlestick Patterns
Spencer Li

Does an Inverted Yield Curve Lead to Recession, and How to Invest in Such a Market?

Trading Strategies & Systems
Inverted yield curve and recession - economics and news

Looking to better understand the economy and financial markets?

The yield curve is a must-know!

This powerful tool shows the relationship between bond interest rates and payback times, giving us valuable insights into what people expect for economic growth and inflation.

But that’s not all – the yield curve can also impact financial institutions and even signal potential recessions.

In this blog post, I’m going to talk about what the yield curve is, why an inverted yield curve can lead to recession, and how to invest in such an environment.

 
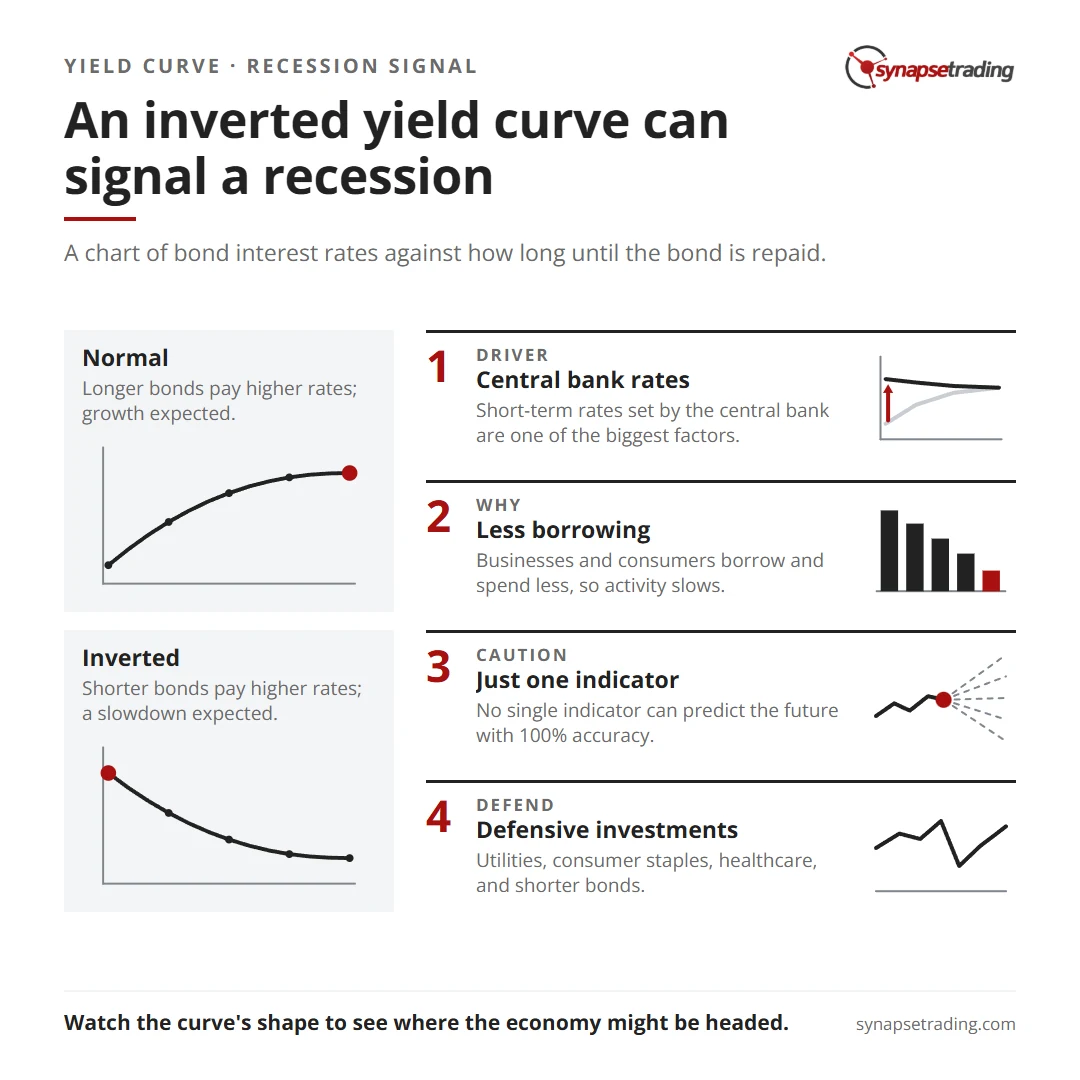
An inverted yield curve can signal a recession. Summary card for the post: Does an Inverted Yield Curve Lead to Recession, and How to Invest in Such a Market?.

What is the Yield Curve?

The yield curve is a chart that shows the relationship between the interest rate earned by investors on a bond and how long it will take for the bond to be repaid.

It’s usually plotted on a graph with the interest rate on the vertical axis and the time it takes to repay the bond on the horizontal axis.


normal yield curve

When the curve is going up, it means that bonds with longer payback times have higher interest rates than bonds with shorter payback times.

This is called a normal yield curve.


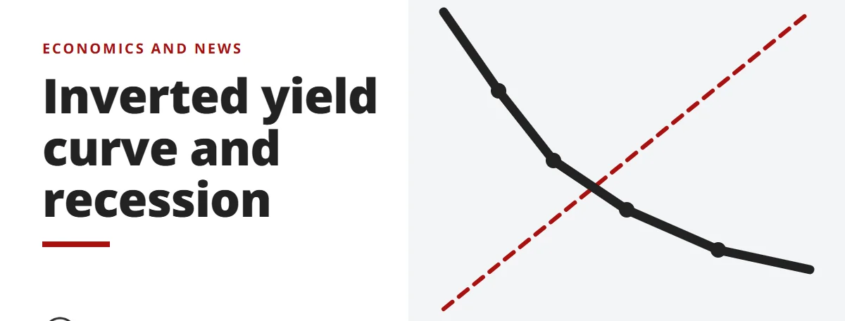
Yield Curve

When the curve is going down, it means that bonds with shorter payback times have higher interest rates than bonds with longer payback times.

This is called an inverted yield curve.

What Can the Yield Curve Tell Us?

The yield curve is a really important indicator of what’s going on in the economy because it gives us an idea of what people expect to happen with economic growth and inflation in the future.

A normal yield curve usually means that the economy is doing well and that people expect economic growth and inflation to pick up in the future, which is why they’re willing to accept lower interest rates on long-term bonds.

An inverted yield curve, on the other hand, often means that the economy isn’t doing so hot and that people expect economic growth and inflation to slow down in the future, so they want higher interest rates on long-term bonds.

What Affects the Shape of the Yield Curve?

There are a few things that can affect the shape of the yield curve.

One of the biggest factors is the level of short-term interest rates set by the central bank.

When the central bank raises short-term interest rates, it can lead to an upward sloping yield curve because investors want higher interest rates on long-term bonds to make up for the increase in short-term rates.

When the central bank lowers short-term interest rates, it can lead to a downward sloping yield curve because investors are willing to accept lower interest rates on long-term bonds due to the lower short-term rates.

The supply and demand for bonds can also affect the yield curve.

If there’s a lot of bonds available in the market, it can push down bond interest rates and lead to a downward sloping yield curve.

If there’s not a lot of bonds available, it can lead to higher bond interest rates and an upward sloping yield curve.

The expectations of market participants about future economic conditions can also influence the yield curve.

If people expect economic growth and inflation to pick up in the future, they might be willing to accept lower interest rates on long-term bonds in the hopes of getting higher returns later on.

This can lead to an upward sloping yield curve. If people expect economic growth and inflation to slow down, they might want higher interest rates on long-term bonds to make up for the lower expected returns.

This can lead to a downward sloping yield curve.

How Does an Inverted Yield Curve Lead to Recession?

Okay, so why does an inverted yield curve lead to a recession?

It’s all about how it can affect the behavior of businesses and consumers.

When the yield curve is inverted, with short-term rates higher than long-term rates, it can signal that investors are more worried about the short-term economic outlook.

This can make businesses less likely to borrow money for long-term projects, like building new factories or expanding operations.

And it can also make consumers less likely to take out long-term loans, like mortgages, to buy homes or cars.

When businesses and consumers are less likely to borrow and spend money, it can lead to a slowdown in economic activity, which can potentially turn into a recession.

An inverted yield curve can also affect the way banks and other financial institutions make lending decisions, which can further impact economic activity.

It’s important to note that the yield curve is just one indicator and no single indicator can predict the future with 100% accuracy.

But it can give us an idea of what people are expecting to happen with economic growth and inflation in the future, which can be helpful in understanding the potential risks and opportunities in the financial markets.

How to Invest in an Inverted Yield Curve Environment

So, you’re wondering how to invest during an inverted yield curve environment?

This can be tricky because an inverted yield curve is often seen as a sign of an impending recession, which is generally not good news for the economy.

However, there are a few strategies you can consider.

One option is to focus on defensive investments that tend to do well when times are tough.

These might include stocks in utilities, consumer staples, and healthcare companies, as well as bonds with shorter payback times.

Another strategy is to diversify your portfolio to include a mix of different types of assets.

This could mean stocks, bonds, real estate, and other alternative investments.

Diversification can help to spread out your risk and increase your chances of making some money over the long haul.

It’s also important to think about your investment time frame and risk tolerance.

If you have a longer time horizon and are comfortable with taking on some risk, you might be able to ride out market ups and downs and potentially benefit from a rebound.

But if you have a shorter time frame or are more risk-averse, it might be smart to be more cautious and reduce your exposure to risky assets.

Just keep in mind that investing during an inverted yield curve environment can be complicated and carries its own risks.

Concluding Thoughts

In conclusion, the yield curve is a really useful tool for understanding what people expect to happen with the economy and the potential risks and opportunities in the financial markets.

It’s important for investors, policymakers, and market participants to pay attention to the shape of the yield curve to get a sense of where the economy might be headed and what the potential implications might be.

Now that I have shared all about the inverted yield curve, what do you think are some of the best investment opportunities and strategies to use when the yield curve is inverted?

Let me know in the comments below.

by Spencer Li
https://synapsetrading.com/wp-content/uploads/2026/10/inverted-yield-curve-recession-card.webp 630 1200 Spencer Li https://synapsetrading.com/wp-content/uploads/2026/10/synapse-logo-horizontal-light.png Spencer Li2022-12-19 12:58:272026-09-16 08:21:12Does an Inverted Yield Curve Lead to Recession, and How to Invest in Such a Market?
Page 3 of 12‹12345›»

Free checklist

The 15-Minute Swing Trader’s Checklist

The daily and weekly routine I use to find, manage and review trades in about 15 minutes a day, trading since 2007.

Get the free checklist

Topics

  • Trading foundations
  • Technical analysis
  • Strategies and systems
  • Risk and money
  • Trading psychology
  • Markets and products

Synapse Trading

Swing trading for busy professionals, in 15 minutes a day.

Start free

Learn

  • Start here
  • Free trading guides
  • Blog
  • Tools and resources

Programs

  • Trading Mastery Program
  • Daily trading signals
  • Student results
  • Public trade log

Company

  • About
  • Contact me
  • Partnerships
  • Disclaimer
  • Privacy policy
  • Terms & Conditions

Synapse Trading Pte Ltd
Registration No. 201316168H
WhatsApp +65-8897-1204
info@synapsetrading.com

Contact Us

Synapse Trading Pte Ltd
Registration No. 201316168H

Whatsapp: +65-8897-1204
Telegram: @iamrecneps
Email: info@synapsetrading.com

Links

Disclaimer
Privacy policy
Terms & Conditions
Contact us
Partnerships

© 2012-2026 Synapse Trading | All rights reserved. Educational content only, not personalised financial advice. Trading carries risk, including loss of capital. Past performance is not indicative of future results. Synapse Trading is not licensed or regulated by MAS.
  • Link to Facebook
  • Link to X
  • Link to Instagram
  • Link to Youtube
  • Link to LinkedIn
  • Link to Mail
Scroll to top Scroll to top Scroll to top