• Link to Facebook
  • Link to X
  • Link to Instagram
  • Link to Youtube
  • Link to LinkedIn
  • Link to Mail
Free PDF: The 15-Minute Swing Trader's Checklist, the daily routine of a trader since 2007
Synapse Trading
  • Mentoring
    • Trading Mastery Program
    • All mentoring options
  • Signals
    • Daily trading signals
    • Signals trade log
  • Results
    • Student results and testimonials
    • Public trade log, losses left in
  • Free guides
    • Start here
    • Trading foundations
    • Technical analysis
    • Strategies and systems
    • Risk and money
    • Trading psychology
    • Markets and products
    • Free trading guides
    • Tools and resources
    • Blog
  • About
    • My background
    • My trading journey
    • Media and interviews
    • Travel log
  • Contact
    • Contact me
    • Partnerships
  • Start free
  • Click to open the search input field Click to open the search input field Search
  • Menu Menu
Spencer Li

Is Trading Skill or Luck? How to Tell if Your Strategy Has Stopped Working

Trading Strategies & Systems
Trading: skill or luck? - trading psychology

Last updated: 26 September 2026 · By Spencer Li, CFTe


Over a short run of trades, trading results are mostly luck. Over a long run, skill starts to show. The honest answer to “is my strategy broken?” depends on how many trades you have, whether your recent results sit inside the normal range for your strategy, and whether something real has changed.

Here is how strong the luck is. In a simulation of 100,000 traders with no edge at all, flipping a coin on every trade, about 1 in 4 finished 50 trades up by 6R or more. That is 6 times their risk per trade, from pure chance. And a trader with a genuine edge was still behind after 20 trades about 1 time in 4.

So most questions about skill, or about a broken strategy, are asked too early. In this post, I’ll show you the numbers, the 3 checks I use, and what they say about my own public trade log, including the part where my edge has been shrinking.
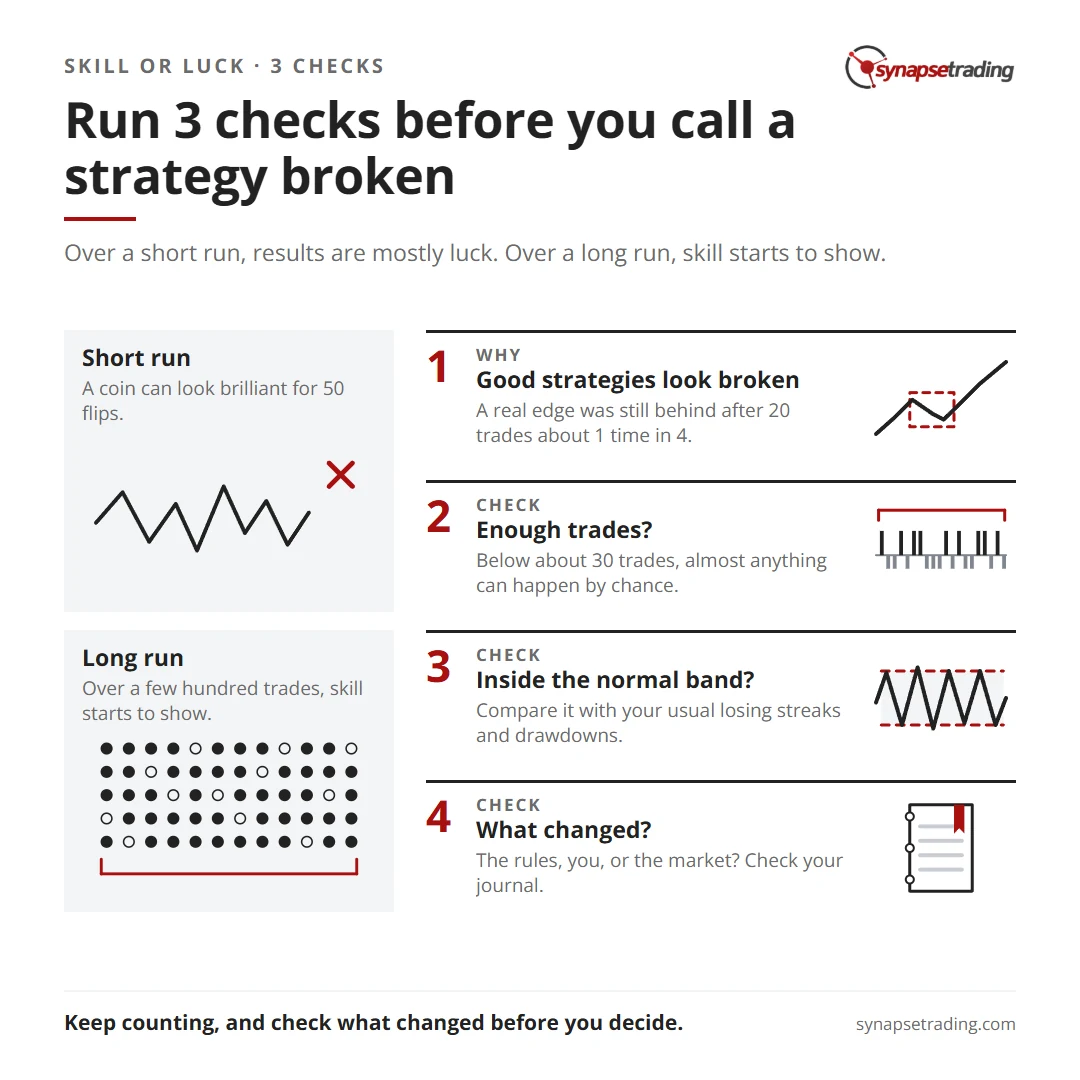
Run 3 checks before you call a strategy broken. Summary card for the post: Is Trading Skill or Luck? How to Tell if Your Strategy Has Stopped Working.

How much can luck hide in trading results?

Far more than it feels like. Imagine 100,000 traders who each flip a coin to decide every trade. They win 1R or lose 1R, 50/50, so their true edge is exactly zero. R is the amount risked on one trade.

After 50 trades, traders with zero edgeShare of the 100,000
Ahead at allabout 44%
Up 6R or moreabout 24%
Up 10R or moreabout 10%

One in 10 coin-flippers is up 10R after 50 trades. If they each wrote a blog, a tenth of them would look like experts. With a lower win rate and bigger winners, the lucky tail gets fatter: a zero-edge trader who wins a third of the time at 2R finished 50 trades up 10R or more about 20% of the time.

This is why a hot streak proves very little. Our post on representativeness bias covers why the brain sees a pattern in 10 trades anyway.

Can a good strategy look broken?

Yes, and for longer than most people would wait. I simulated a strategy with a real, positive edge: it wins 40% of the time, its winners are 2R, its losers are 1R. On average it makes 0.2R per trade.

A real +0.2R edge, afterShare of runs still behind or flat
20 tradesabout 25%
50 tradesabout 16%
100 tradesabout 9%
200 tradesabout 2.5%

A trader with this edge has about a 1 in 4 chance of being behind after 20 trades, and about a 1 in 11 chance after 100. The same strategy hit 10 or more losses in a row somewhere within 200 trades in about 38% of runs. A trader who gives up inside that window and switches to a new method starts the same wait over again, with a fresh sample of zero.

Our post on the law of large numbers in trading shows how wide the win-rate range is at each sample size. The short version is that small samples are loud.

What are the 3 checks?

I call these the 3 checks. I run them in order, and I do not skip to the third.

  1. Enough trades? Below about 30 trades, almost anything can happen by chance. For the strategy above, the 95% range around its measured edge is roughly plus or minus 0.5R after 30 trades, and about plus or minus 0.2R after 200. The edge itself is only 0.2R. So after 30 trades you cannot tell this strategy from a losing one. This is why we ask students for 100 to 200 trades before judging a method.
  2. Inside the normal band? Compare the recent run with what your strategy normally does. Look at the length of its usual losing streaks and the depth of its usual drawdowns. A 9-trade losing streak is routine for a strategy that wins 40% of the time. The numbers to track are in the performance numbers that matter, and the formula is in our post on trading expectancy.
  3. What changed: the rules, you, or the market? Check your trading journal. First see whether you followed the rules or started bending them. Then see whether the market has moved into a kind of weather your method was not built for, like the chop in how to trade a choppy or volatile market. Last, ask whether the edge itself has faded, because the pattern got crowded or the market’s structure changed.
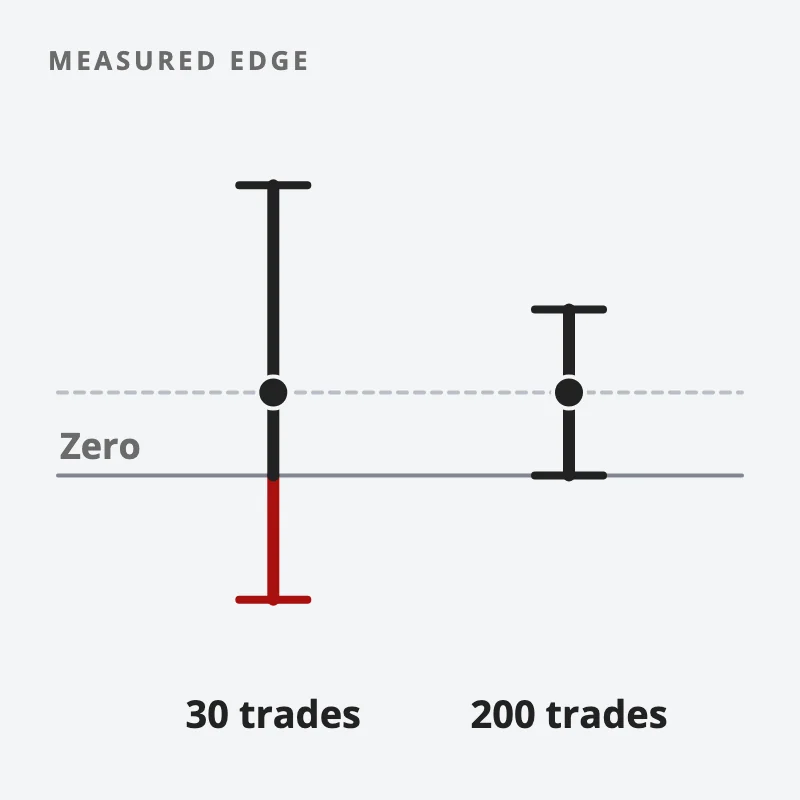
Two ranges around the same measured edge: after 30 trades the range dips below zero, after 200 trades it is much narrower
After 30 trades a real edge can still look like a losing one; 200 trades narrow it.

Only the last answer means “the strategy has stopped working”. The first 2 are about you and the weather, and they call for a different fix.

If you want a simple routine for logging and reviewing trades, it is part of the free checklist at the end of this post.

What does my own trade log show?

My trade log is public, with every closed trade since April 2024, dated, losses left in. As at 16 October 2026 it holds 484 closed trades. Here it is by the year each trade was opened.

Year openedClosed tradesShare that wonAverage win compared with average lossEdge per trade, in average losses
202477about 58%about 3.9 to 1about 1.9
2025257about 52%about 3.2 to 1about 1.2
2026, to date150about 45%about 2.2 to 1about 0.4

The last column puts the first two together. It is the average trade, measured in units of my average losing trade. It is still above zero, but it has shrunk every year. Past results do not guarantee future ones, and that cuts both ways.

So I ran the 3 checks on myself.

  • Check 1, enough trades. Yes. There are 150 trades so far in 2026 and 257 in 2025, enough to compare the two years.
  • Check 2, the normal band. Partly. On the win rate alone, the drop from 2025 to 2026 is still within what chance could produce. But when I shuffled all the 2025 and 2026 trades together 20,000 times, a drop in the average trade as large as the real one came up only about 2% of the time. So the decline in the average trade is probably real.
  • Check 3, what changed. Part of the answer is already in my journal. In June 2026 I had a rule for trimming a concentrated book, did not fire it, and gave back most of the year’s gains in 2 days. My journal called it a discipline lapse, and that part was me rather than the market. The rest of the answer needs more trades and a closer look at which setups have faded.

Personally, I think this is the most useful table I can publish. A track record that only goes up teaches nothing about this question. Mine shows the edge getting smaller, in public, while I work out why.

So, is trading skill or luck?

Both, and the mix depends on the time frame. Over 10 trades, it is mostly luck. Over 50, luck is still loud enough to make a coin-flipper look gifted. Over a few hundred, skill or the lack of it starts to show through, which is why our post on win rate versus risk reward and the trade log both lean on large samples.

A coin can look brilliant for 50 flips. The way to tell a trader from a coin is to keep counting, keep the losses in the record, and check what changed before you decide what broke.

FAQ

Is trading skill or luck?

Both. Over a few dozen trades, luck dominates. In a simulation of traders with zero edge, about 1 in 10 was up 10R or more after 50 trades. Skill shows up only over a few hundred trades.

How many trades do you need to know if a strategy works?

At least 100, and 200 is better. For a strategy with a 0.2R edge, the 95% range around the measured result is about plus or minus 0.5R after 30 trades, which is too wide to tell it from a losing strategy.

How do I know if my trading strategy has stopped working?

Check 3 things in order: that you have enough trades to judge, whether the recent run sits outside your strategy’s normal range of losing streaks and drawdowns, and whether the rules, your discipline or the market changed. If the losing has gone on for years, start with this 3-question audit before you quit trading.

How long can a losing streak last with a good strategy?

Longer than most people expect. A strategy that wins 40% of the time at 2R per winner had a losing run of 10 or more somewhere in 200 trades in about 38% of simulated runs.

Should I change my strategy after a losing streak?

A streak alone is too little to go on. Run the 3 checks first. A long losing streak can be normal for a sound strategy, and switching methods resets your sample to zero.

Go deeper

The free 15-Minute Swing Trader’s Checklist has the daily routine, the questions to ask before every trade, and the five rules that keep you in the game.


About the author. Spencer Li is The 15-Minute Trader and the founder of Synapse Trading. He is a Certified Financial Technician (CFTe) with 15+ years of trading, run from 70+ countries. He holds a B.Acc and B.BM from SMU. Every trade he takes is public, dated, losses left in. He teaches low-risk swing trading in 15 minutes a day, one system for any market.

Educational content only, not personalised financial advice. Trading carries risk, including loss of capital. Past performance is not indicative of future results. Synapse Trading is not licensed or regulated by MAS.
by Spencer Li
https://synapsetrading.com/wp-content/uploads/2026/10/trading-skill-or-luck-card.webp 630 1200 Spencer Li https://synapsetrading.com/wp-content/uploads/2026/10/synapse-logo-horizontal-light.png Spencer Li2026-07-28 17:08:572026-10-22 12:58:39Is Trading Skill or Luck? How to Tell if Your Strategy Has Stopped Working
Spencer Li

What Is Position Trading? How It Compares With Swing Trading and Investing

Trading Strategies & Systems
What is position trading? - trading styles

Last updated: 3 October 2026 · By Spencer Li, CFTe


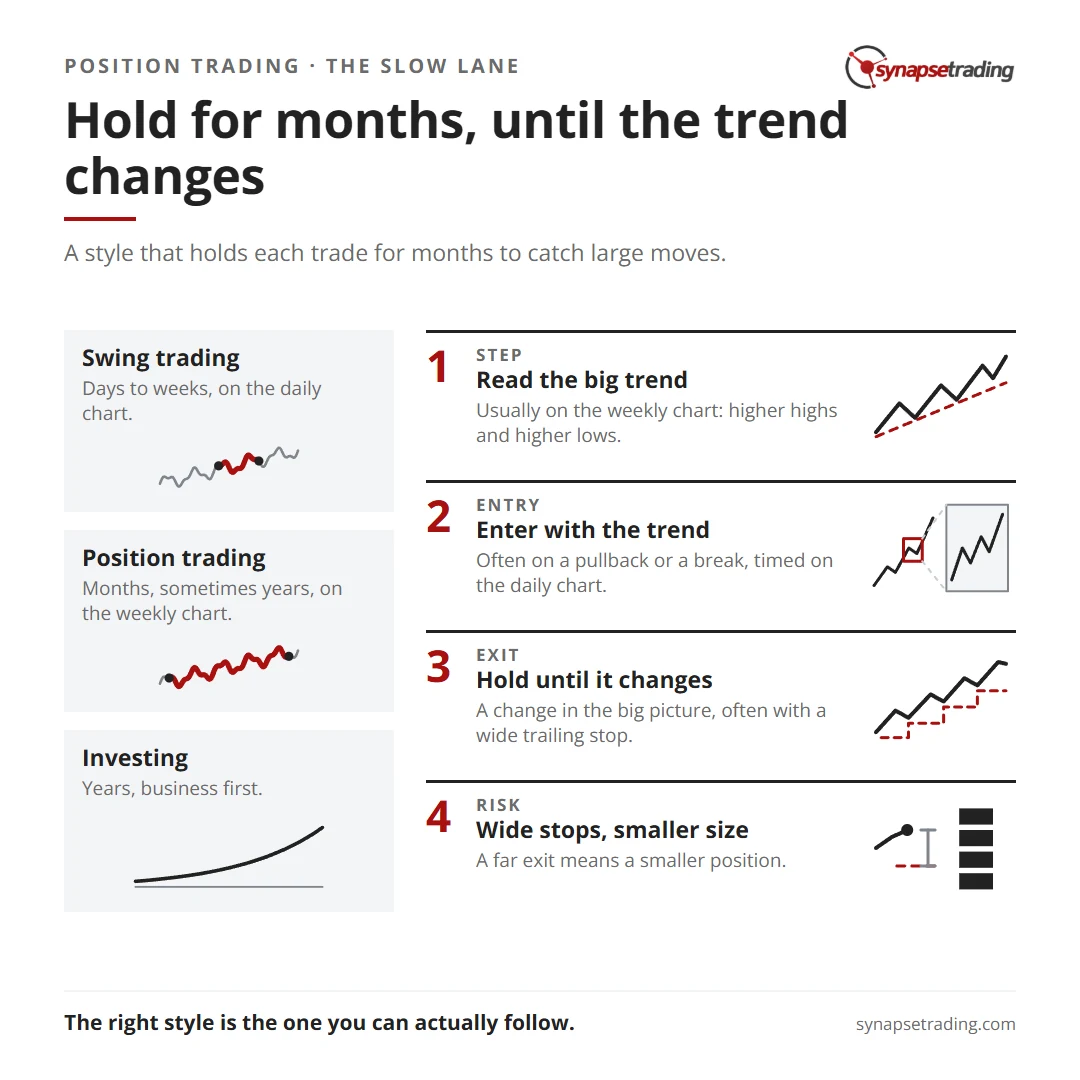
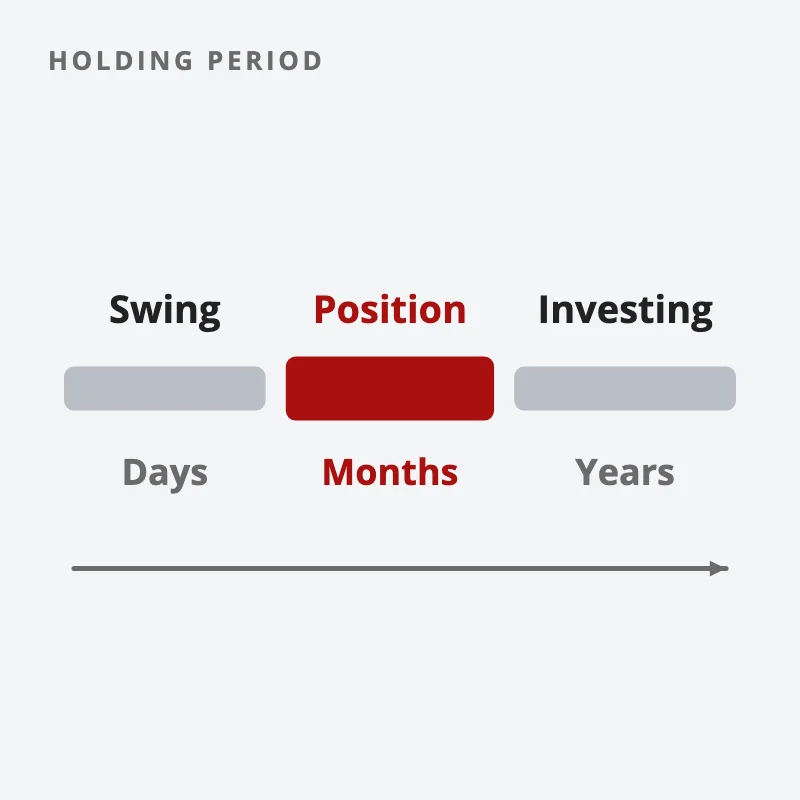
Position trading is a trading style that holds each trade for months, sometimes years, to catch large moves in the direction of a long trend. It sits between swing trading, which holds for days to weeks, and investing, which holds for years and is mostly about owning good assets rather than timing them.

A position trader makes few trades, uses weekly and daily charts, and spends very little time watching the screen. The price of that calm is patience, because you sit through pullbacks that would stop out a swing trader and you may wait months to find out whether you were right at all.

In this post, I’ll walk you through how position trading works, how it compares with swing trading and investing, and what holding longer actually changes.

Hold for months, until the trend changes. Summary card for the post: What Is Position Trading? How It Compares With Swing Trading and Investing.

What is position trading?

Think of it as driving in the slow lane on a long highway. You overtake rarely, you do not react to every car, and you only change lanes when the road itself changes.

A position trader does 3 things.

  1. Reads the big trend first. Usually on the weekly chart. Is the market making higher highs and higher lows over months? Our post on market structure shows how to read that.
  2. Enters in the direction of that trend. Often on a pullback or a break, using the daily chart to time it. Our post on combining multiple timeframes covers how the 2 charts work together.
  3. Holds until the trend changes. Not until a target is hit, or a few weeks pass. The exit is a change in the big picture, often managed with a wide trailing stop.

It is a close cousin of trend following. Many position traders are trend followers who simply use a slower clock.

How does position trading compare with swing trading and investing?

Here is the short version.

Swing tradingPosition tradingInvesting
Typical holdDays to weeksMonths, sometimes yearsYears
Main chartDailyWeekly, timed on the dailyOften none, business first
Trades a yearDozens to hundredsA handful to a few dozenVery few
Screen timeShort daily routineA weekly reviewOccasional
Main questionWhat will price do in the next few weeks?Is the long trend still intact?Is this a good asset to own?
Biggest riskMany small losses in chopLong, deep pullbacks, and gaps over weekends and resultsOwning something broken for too long

Our older post on different trading styles adds day trading and scalping to the left of this table. And our guide to building an investment portfolio covers the column on the right.

The line between position trading and investing is not the holding period alone. A position trader exits when the trend breaks, even if the asset is still “good”, while an investor holds a good asset through a broken trend for as long as the business itself is fine. One reads the chart first. The other reads the business first.

Three trading styles on one line of holding time: swing for days, position trading for months highlighted, investing for years
Position trading holds for months, between swing trading’s days to weeks and investing’s years.

What does holding longer actually change?

I measured it. I took the S&P 500 index from 2000 to 2025 and asked a simple question: over different holding periods, how big is a typical move, up or down?

Holding period, S&P 500, 2000 to 2025Typical move, up or down (median)
1 dayabout 0.5%
1 weekabout 1.3%
1 monthabout 2.8%
6 monthsabout 7.8%
1 yearabout 13.7%

Two things follow from this table.

Costs shrink. Take a hypothetical round-trip cost of 0.2%, for commissions and the spread together. Against a typical 1-day move of about 0.5%, that cost eats about 37% of it. Against a typical 6-month move of about 7.8%, it eats about 2.6%. The longer you hold, the less your costs matter.

Noise shrinks relative to the move. Daily wiggles do not disappear for a position trader. They just matter less, because the move you are waiting for is many times larger than any single day.

That is the case for the slow lane. The case against it comes next.

What are the downsides of position trading?

It is not easier. It is differently hard.

  • Wide stops. A trend that runs for months will pull back along the way, sometimes sharply. Your exit has to sit far enough away to survive that, which means each trade needs a smaller position for the same amount of risk than a swing trade on the same account would. Our post on position sizing covers the arithmetic.
  • Gaps. You will hold through weekends, results and surprise news. Price can open far beyond where your stop sits, and you take the gap.
  • Few trades, slow feedback. If you make 10 trades a year, it can take years to know whether your approach works. That is a long time to keep faith in a method.
  • Giving back open profit. Holding until the trend changes means watching part of a large gain disappear before you exit. Many people cannot sit through that.

Personally, I think the last one is the hardest. Watching a big open gain shrink feels like losing, even when the plan is working exactly as designed.

If you want a short routine for checking the big picture without staring at screens, it is in the free checklist at the end of this post.

Is position trading right for you? The time, cost and patience test

I call this the time, cost and patience test. Answer 3 questions honestly.

  1. Time. How much screen time can you give each week? If the answer is close to none, a slower style fits better than a faster one.
  2. Cost. How much do your trades cost, as a share of the moves you are trying to catch? If costs are eating a large slice of a typical move, slowing down helps.
  3. Patience. Can you sit through a 10% pullback in a trade you still believe in, without touching it? Can you go 3 months without a new trade? If not, a faster style may suit your temperament better, even if it costs more.

There is no best answer. Our post on swing trading versus intraday trading makes the same point one step faster: the right style is the one you can actually follow. And patience and discipline matter in every lane.

The slow lane is not for everyone. But for traders who have a job, a family and no wish to watch every tick, it can be the lane where they finally stop crashing into their own impatience.

FAQ

What is position trading?

It is a trading style that holds positions for months, sometimes years, to capture large moves in the direction of a long-term trend. Position traders use weekly and daily charts and trade much less often than swing or day traders.

How long do position traders hold trades?

Usually months. Some positions last a year or more if the trend continues. The exit is triggered by a change in the trend rather than by a fixed date.

What is the difference between position trading and swing trading?

Holding period and focus. Swing traders hold for days to weeks and aim to catch one leg of a move. Position traders hold for months and aim to ride the whole trend, accepting deeper pullbacks along the way.

What is the difference between position trading and investing?

Position traders exit when the price trend breaks, whatever they think of the asset. Investors hold assets they believe are good, often through broken trends, because their decision rests on the business or the fundamentals.

Is position trading good for beginners?

It needs less screen time and lower trading costs, which helps. But it gives slow feedback and asks for a lot of patience through pullbacks, which many beginners find harder than they expect.

Go deeper

The free 15-Minute Swing Trader’s Checklist has the daily routine, the questions to ask before every trade, and the five rules that keep you in the game.


About the author. Spencer Li is The 15-Minute Trader and the founder of Synapse Trading. He is a Certified Financial Technician (CFTe) with 15+ years of trading, run from 70+ countries. He holds a B.Acc and B.BM from SMU. Every trade he takes is public, dated, losses left in. He teaches low-risk swing trading in 15 minutes a day, one system for any market.

Educational content only, not personalised financial advice. Trading carries risk, including loss of capital. Past performance is not indicative of future results. Synapse Trading is not licensed or regulated by MAS.
by Spencer Li
https://synapsetrading.com/wp-content/uploads/2026/10/position-trading-card.webp 630 1200 Spencer Li https://synapsetrading.com/wp-content/uploads/2026/10/synapse-logo-horizontal-light.png Spencer Li2026-06-29 15:51:092026-10-03 21:43:28What Is Position Trading? How It Compares With Swing Trading and Investing
Spencer Li

What Is Trend Following? How the Strategy Works, and Why It Feels Wrong Most of the Time

Trading Strategies & Systems
What is trend following? - trading strategies

Last updated: 19 August 2026 · By Spencer Li, CFTe


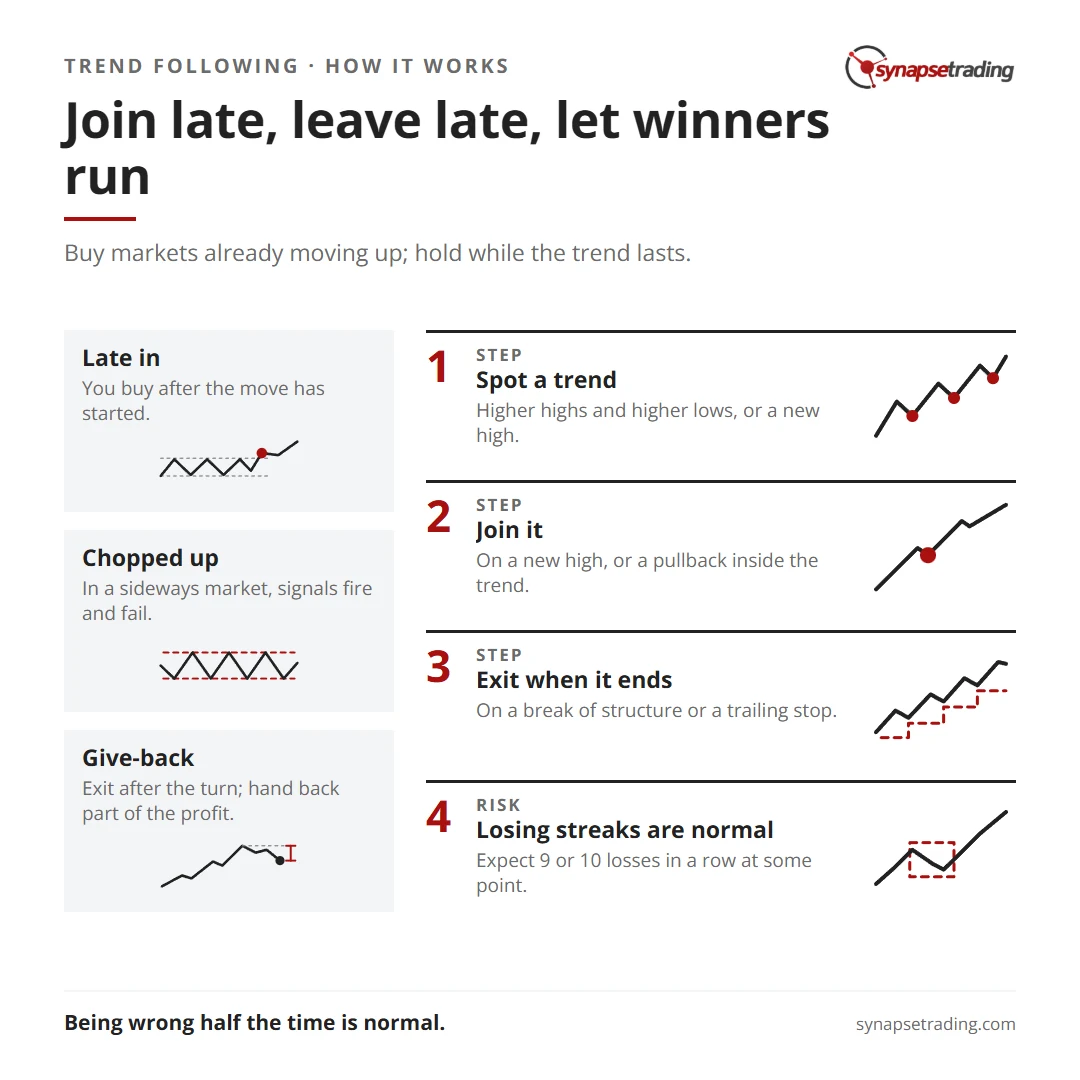
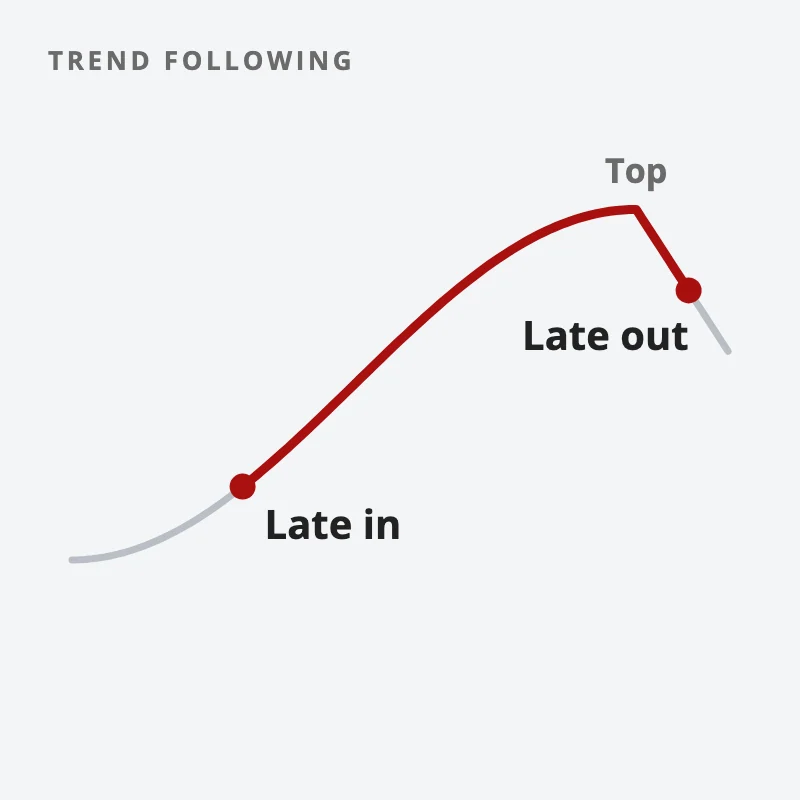
Trend following is a trading strategy that buys markets already moving up, sells or avoids markets already moving down, and holds each position for as long as the trend lasts. It makes no forecast. It waits for a move to show itself, joins it late, and leaves late, after the move has ended.

That lateness is the price of the whole approach. Trend followers lose a lot of small trades in markets that go nowhere, and they rely on a few large moves to pay for all of them. When I ran a simple, public trend rule on 2 markets over 26 years, it lost on about half its trades, and its 5 biggest winners out of 120 trades produced nearly 30% of all the gains.

So the strategy is simple to describe and hard to live with. In this post, I’ll walk you through how it works, the evidence behind it, and why it feels wrong most of the time.

Join late, leave late, let winners run. Summary card for the post: What Is Trend Following? How the Strategy Works, and Why It Feels Wrong Most of the Time.

What does trend following actually do?

Think of it as surfing rather than weather forecasting. A surfer cannot make a wave and does not try to predict the next one. He waits, paddles when one forms, rides it as far as it goes, and paddles back out.

A trend follower does 3 things in that order.

  1. Spots a trend. Price is making higher highs and higher lows, it has broken to a new high, or it sits above a rising moving average. Our post on market structure shows the first method, and our post on trend-following indicators covers the others.
  2. Joins it. Either on a break to a new high, or on a pullback inside the trend. Both are common, and each has its own failure mode.
  3. Exits when the trend ends. Usually on a break of structure, a trailing stop, or a crossover back the other way. The exit is designed to give back part of the move, which is the cost of never knowing where the top is.

In our guide to trading strategies, this is the setup type we call Swing: join an established trend and ride it. It needs one thing from the market above all, a clear trend, and it fails when the market chops sideways.

A price move rising to a top and falling; the trade covers only the middle, entering after the low and exiting after the top
Trend following joins a move late and leaves late, after the move has ended.

Does trend following work?

There is more evidence for this family than for almost any other. In 2017, Brian Hurst, Yao Hua Ooi and Lasse Pedersen published a study in the Journal of Portfolio Management that rebuilt a simple trend strategy across many markets back to 1880. They found it “was consistently profitable over the next 110 years”.

That is a remarkable record, and it deserves 2 honest footnotes. It is a historical study, and past results do not promise future ones. And “consistently profitable over 110 years” still includes long, painful stretches inside those years, which is exactly what makes the strategy hard to follow.

I wanted to see the shape for myself, so I ran the classic public channel rule on 2 markets. Buy when the daily close breaks above the highest high of the past 50 days, and sell when it closes below the lowest low of the past 20 days. I used the S&P 500 index and gold, from 2000 to 2025.

What I measured, 2000 to 2025S&P 500GoldBoth
Trades6357120
Share that wonabout 49%about 49%about 49%
Average win compared with average lossabout 1.5 to 1about 1.8 to 1about 1.7 to 1
Share of all gross gains from the 5 biggest winnersabout 29%

Half the trades lost. The ones that won were bigger than the ones that lost. And a handful of very large winners carried a big share of the result. That is the trend-following profile in one table, and it is also why missing a few of those big trends is so costly.

Do note this is a simple rule on 2 markets, run to show the shape, and nothing more. It is not a system I am suggesting you trade.

Why does trend following feel wrong most of the time?

Because it asks you to do 3 uncomfortable things, over and over. I call them the 3 costs of trend following.

  1. Late in. You buy after the move has started, at a higher price than the people who bought the bottom. It feels like chasing.
  2. Chopped up. In a sideways market, the trend signals fire and fail, fire and fail. Each loss is small, and they pile up.
  3. Give-back. When a trend ends, you exit after it has already turned, so you hand back part of the open profit. It feels like watching money leave.

None of these is a flaw in the method. They are the method. A trend follower who tries to remove the lateness by buying earlier has become a reversal trader, with a different set of problems.

How long are the losing streaks?

Longer than most people expect. I simulated 2 hypothetical trend-style strategies, each over 200 trades and 100,000 runs, and measured the longest run of consecutive losses.

Hypothetical strategyLongest losing run within 200 trades, medianChance of 10 or more losses in a row within 200 trades
Wins 40%, average win 2R, average loss 1R9about 38%
Wins 35%, average win 3R, average loss 1R10about 61%

R is the amount you risk on one trade. Both strategies make money on average. Both will hand you 9 or 10 losses in a row at some point, as a matter of routine arithmetic.

This is where most trend followers quit. Not in the middle of a disaster, but in the middle of an ordinary losing streak, a few weeks before the next big trend arrives. The arithmetic behind that is in our post on win rate versus risk reward, and the honest way to tell a streak from a broken strategy is in skill or luck.

If you want a routine that keeps you consistent through the boring part, the 15-minute version I run after the close is in the free checklist at the end of this post.

What does this look like in a real trading record?

My own public trade log is a mix of setups, and it shows the same shape. As of 16 October 2026 it holds 484 closed trades. About 51% of them won, and the average winner was a little over 3 times the size of the average loser. I lose on roughly half my trades, and the account is carried by the size of the winners. You can read every one of them, losses included, on the trade log page.

Personally, I think that is the most useful thing a beginner can see. Being wrong half the time is normal in this family. Cutting the losers small and letting the winners run is what does the work.

How is trend following different from mean reversion?

They are opposites. Trend following bets that a move will continue. Mean reversion bets that a stretched move will snap back.

Trend following (Swing)Mean reversion (Bounce)
BuysStrengthWeakness
Typical win rateLowerHigher
Typical payoffA few large winnersMany small winners, occasional large loser
Market it needsA clear trendA sharp spike, then calm
How it usually failsChop, many small lossesA move that keeps stretching

Many traders use both, matched to the market. A close cousin, momentum trading, buys whatever has risen most across many stocks, rather than following the trend on one chart. When the market is trending, they join it. When it is stuck in a range, they look at the edges or at breakouts. When it is just messy, they trade less, which is the subject of how to trade a choppy market.

Which tools do trend followers use?

Fewer than you would think. A moving average or two to judge direction, covered in moving average crossover strategies. A channel of recent highs and lows, like the Donchian channel behind the rule above. And an exit that follows price up, such as a trailing stop.

The tool matters less than the rules around it: how big each position is, where you are proven wrong, and the patience to sit through the streaks.

Trend following asks you to buy high and sell higher, which goes against every instinct a bargain hunter has. The people who manage it are rarely the smartest in the room. They are the ones who can stay late, wrong half the time, and still there when the big trend finally comes.

FAQ

What is trend following in trading?

It is a strategy that joins a market already moving in one direction and holds until the move ends. It does not predict turns, and it accepts getting in late and out late in exchange for catching the large moves.

Does trend following still work?

A 2017 study in the Journal of Portfolio Management rebuilt a trend strategy back to 1880 and found it consistently profitable over the next 110 years. That is history, and past results do not guarantee future ones.

What is the win rate of trend following?

Often around half or lower. A simple channel rule on the S&P 500 and gold from 2000 to 2025 won about 49% of its trades, and relied on its winners being larger than its losers.

Why do trend followers lose so often?

Because markets spend long periods going sideways, and every trend signal in a sideways market tends to fail. The small losses from those signals are the cost of being in the trends that do run.

Is swing trading the same as trend following?

Not exactly. Swing trading describes a holding period of days to weeks. Trend following describes what you bet on. Many swing traders follow trends, and at Synapse Trading we call that setup type Swing.

Go deeper

The free 15-Minute Swing Trader’s Checklist has the daily routine, the questions to ask before every trade, and the five rules that keep you in the game.


About the author. Spencer Li is The 15-Minute Trader and the founder of Synapse Trading. He is a Certified Financial Technician (CFTe) with 15+ years of trading, run from 70+ countries. He holds a B.Acc and B.BM from SMU. Every trade he takes is public, dated, losses left in. He teaches low-risk swing trading in 15 minutes a day, one system for any market.

Educational content only, not personalised financial advice. Trading carries risk, including loss of capital. Past performance is not indicative of future results. Synapse Trading is not licensed or regulated by MAS.
by Spencer Li
https://synapsetrading.com/wp-content/uploads/2026/10/trend-following-card.webp 630 1200 Spencer Li https://synapsetrading.com/wp-content/uploads/2026/10/synapse-logo-horizontal-light.png Spencer Li2026-05-26 22:13:102026-10-22 12:58:55What Is Trend Following? How the Strategy Works, and Why It Feels Wrong Most of the Time
Spencer Li

Market Top or Pullback? How to Tell the Difference

Trading Strategies & Systems
Market top or pullback? - market analysis

Most falls feel like the start of something bigger. The history says most of them are not, and a few signs separate the ones that are

Published: 17 October 2026 · Last updated: 18 September 2026 · By Spencer Li, CFTe


“This is probably the top of this bull market.” A trader posted that on a stock forum in June 2026. Every sell-off brings a wave of posts like it.

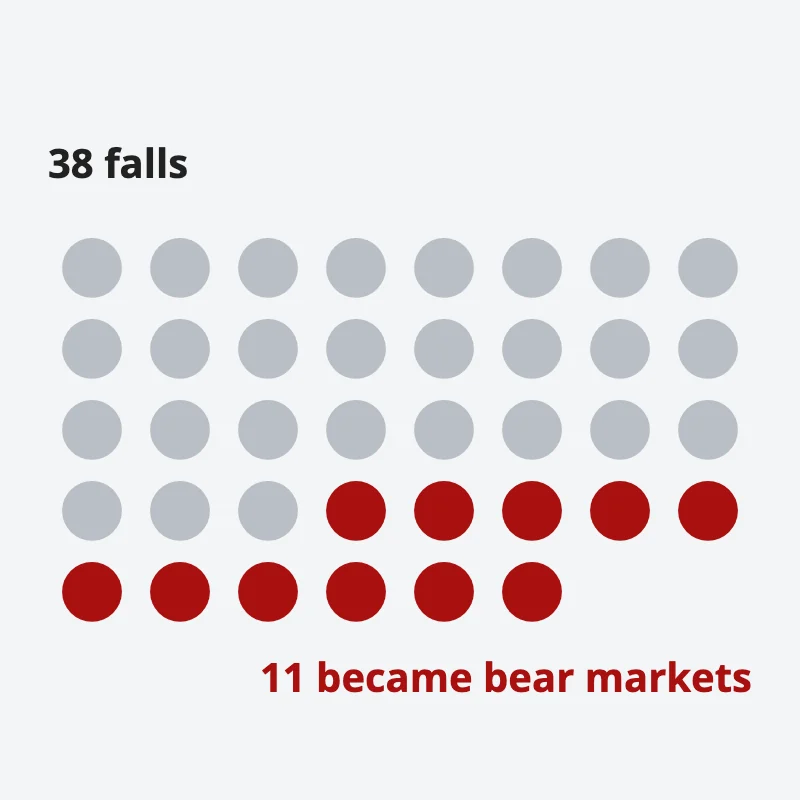
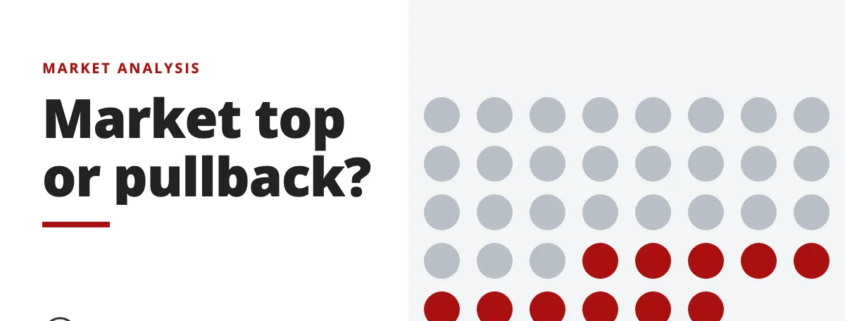
Here is the short answer. In the moment, nobody can tell a top from a pullback for certain. But the odds favour the pullback. From 1950 to October 2022, the S&P 500 had 38 falls of 10% or more on a closing basis. Only 11 of them, or 29%, went on to become bear markets of 20% or more.

38 dots for the S&P 500 falls of 10% or more since 1950; only 11, in red, went on to become bear markets
Most falls of 10% are pullbacks: only 11 of 38 since 1950 became bear markets.

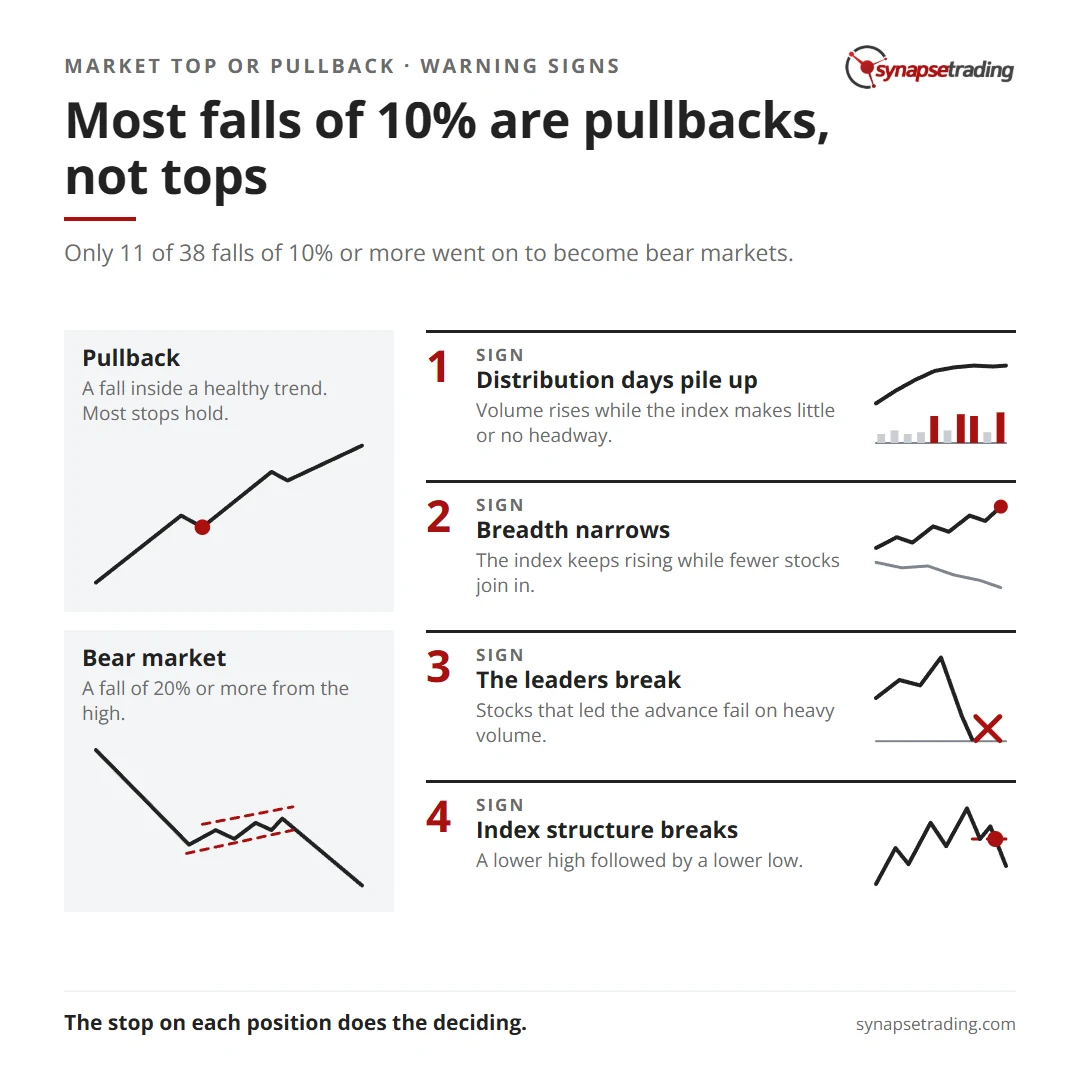
What separates the real tops is a cluster of warning signs that build over weeks, usually while prices are still near their highs. There are 5 to watch: distribution, narrowing breadth, bonds turning first, leaders breaking down, and the index’s own structure breaking. One sign on its own is noise. Several at once deserve your attention.

Most falls of 10% are pullbacks, not tops. Summary card for the post: Market Top or Pullback? How to Tell the Difference.

How often does a pullback turn into a bear market?

Less often than it feels. The figures below are for the S&P 500 on a closing basis from 1950 to October 2022, counted from the Yardeni Research tables of bull and bear markets (October 2022 edition).

Once the fall reachesChance it goes on to1950 to 2022
10%15%18 of 38, or 47%
15%20%11 of 18, or 61%
10%20%11 of 38, or 29%
20%30%6 of 11, or 55%
20%40%3 of 11, or 27%

Two things stand out. At 10% down, the odds are well in favour of a pullback. But once a fall reaches 15%, the odds of it going on to 20% rise to about 3 in 5. Each step down makes the next step more likely.

Do note the 20% line is a convention, and the market does not know it exists. Six falls from 1950 to 2022 stopped between 17% and 19.9%, including 1990, 1998 and 2018. Every one of them turned back up. The 2025 fall, from 19 February to 8 April, stopped at 18.9%. A rule built on the exact 20% line inherits that noise.

What are the 5 warning signs that show up before a real market top?

None of these is a timing signal on its own. They are the signs that, together, separate a top that is forming from a pullback inside a healthy trend.

1. Distribution days pile up. William O’Neil, the founder of Investor’s Business Daily, built his market timing around this idea. A distribution day is a day when volume rises from the day before while the index makes little or no headway. On a down day, the index “should decline more than 0.2%” to count. His key point is that distribution happens while prices are still rising, which is why so few people notice it.

His book gives the count in more than one place, and the figures differ. In one passage, 4 or 5 days of definite distribution over 4 or 5 weeks means the market “will almost always turn down.” Elsewhere, his firm’s rule was 5 or 6 distribution days in any 4 to 5 week window. So treat the count as a range rather than an exact trigger.

2. Breadth narrows. Near a top, the index can keep rising while fewer and fewer stocks join in. The big names carry the average, and the rest quietly roll over. Our guide on what market breadth is explains how to measure it, and the advance/decline line is one of the simplest tools for it. An index at new highs with a falling A/D line is the classic warning.

3. Bonds turn first. John Murphy’s work on intermarket analysis found that “near market tops, the bond market will usually turn down first.” In 1987, bonds broke down in April and stocks topped in August. The lead varies, so this is background, never a trigger.

4. The leaders break. The stocks that led the advance start failing on heavy volume. O’Neil noted that by the time the index shows a clear top reversal, leading stocks have usually been under distribution for days or weeks.

5. The index structure breaks. In an uptrend, the index makes higher highs and higher lows. A close below the last higher low is the first warning. A lower high followed by a lower low is the evidence. Our post on market structure walks through that sequence step by step.

If you want a short daily routine that keeps you checking these things before you act, our free 15-Minute Swing Trader’s Checklist covers it. Get the free checklist →

Why do so many people call the top too early?

Mostly, they are early. A falling market always comes with a story, and stories are convincing. Every 5% dip gets an explanation within hours. Our post on the narrative fallacy looks at why the mind grabs those stories so quickly.

There is also a crowd effect. When everyone online is calling the top, it feels risky not to agree. That is herd mentality at work, and it pushes people out of good positions at exactly the wrong time.

Does a recession make a bear market worse?

Yes, by a clear margin. The 3 deepest S&P 500 bear markets since 1950 all came with a recession: 48.2% in 1973 to 1974, 49.1% in 2000 to 2002, and 56.8% in 2007 to 2009. The deepest bear without a recession was 1987, at 33.5%, and it was over within 4 months.

So the question to ask once a fall passes 20% is whether the economy is heading into a recession too, because the answer shapes how deep the fall is likely to go far more than any chart pattern does.

So what should you do when you are not sure?

A sensible default is to treat every fall as a pullback until the warning signs say otherwise. But that is no reason to wait for certainty to manage risk. The stop on each position does the deciding, one trade at a time. If the market is only pulling back, most stops hold. If it is topping, the stops take you out in stages, long before anyone on the news calls it a bear market.

That approach does not need a forecast. It needs a plan that was written before the fall started. Our guide to money and risk management covers how to set that up.

So, on the market you trade right now, how many of the 5 warning signs can you actually see? And are you reacting to the signs, or to the headlines?

FAQ

How do you know if the market has topped?

You usually only know for sure afterwards. Before that, the signs to watch are distribution days piling up, narrowing breadth, bonds turning down first, leading stocks breaking, and the index making a lower high and a lower low.

What is the difference between a pullback, a correction and a bear market?

The usual convention is that a pullback is a fall of less than 10%, a correction is a fall of 10% to 20%, and a bear market is a fall of 20% or more from the high. The lines are conventions, and several falls since 1950 stopped just short of 20%.

What percentage of corrections become bear markets?

From 1950 to 2022, 11 of 38 S&P 500 falls of 10% or more went on to reach 20%, or about 29%. Once a fall reaches 15%, about 61% went on to reach 20%.

What is a distribution day?

A day when market volume rises from the day before while the index stalls or falls. In William O’Neil’s method, a down day must fall more than 0.2% to count. Several in a few weeks is a warning that big investors are selling.

Should you sell everything when you think the market is topping?

Most traders do better managing each position with its own stop than making one big call. A top is only clear afterwards, and selling everything on a guess risks missing the rebound if it was a pullback.

Go deeper

Telling a top from a pullback is easier with a routine you follow every day, before the headlines get loud. The free 15-Minute Swing Trader’s Checklist has the daily routine, the questions to ask before every trade, and the five rules that protect your account.


About the author. Spencer Li is The 15-Minute Trader and the founder of Synapse Trading. He is a Certified Financial Technician (CFTe) with 15+ years of trading, run from 70+ countries. He holds a B.Acc and B.BM from SMU. Every trade he takes is public, dated, losses left in. He teaches low-risk swing trading in 15 minutes a day, one system for any market.

Educational content only, not personalised financial advice. Trading carries risk, including loss of capital. Past performance is not indicative of future results. Synapse Trading is not licensed or regulated by MAS.
by Spencer Li
https://synapsetrading.com/wp-content/uploads/2026/10/market-top-vs-pullback-card.webp 630 1200 Spencer Li https://synapsetrading.com/wp-content/uploads/2026/10/synapse-logo-horizontal-light.png Spencer Li2026-05-14 13:51:252026-09-18 21:46:58Market Top or Pullback? How to Tell the Difference
Spencer Li

Mean Reversion Trading: How It Works, Why It Wins Often, and How It Loses Big

Trading Strategies & Systems
Mean reversion trading - trading strategies

Last updated: 30 July 2026 · By Spencer Li, CFTe


Mean reversion trading is a strategy that bets a market which has moved too far, too fast, will snap back toward its normal level. You buy after a sharp fall, or sell after a sharp rise, and aim to take a modest profit as price returns toward its average.

It tends to win often and lose big. In 26 years of S&P 500 data, a sharp fall below the 20-day average was followed by at least a halfway recovery within 2 weeks about 65% of the time. But in about 1 case in 4, the index kept falling by more than another 5% first, and in the worst cases it fell another 23% to 31%.

So the strategy is not about spotting stretched markets. Spotting them is easy. It is about surviving the ones that keep stretching. In this post, I’ll walk you through how mean reversion works, what the data says, and the 3 questions I ask before fading any move.

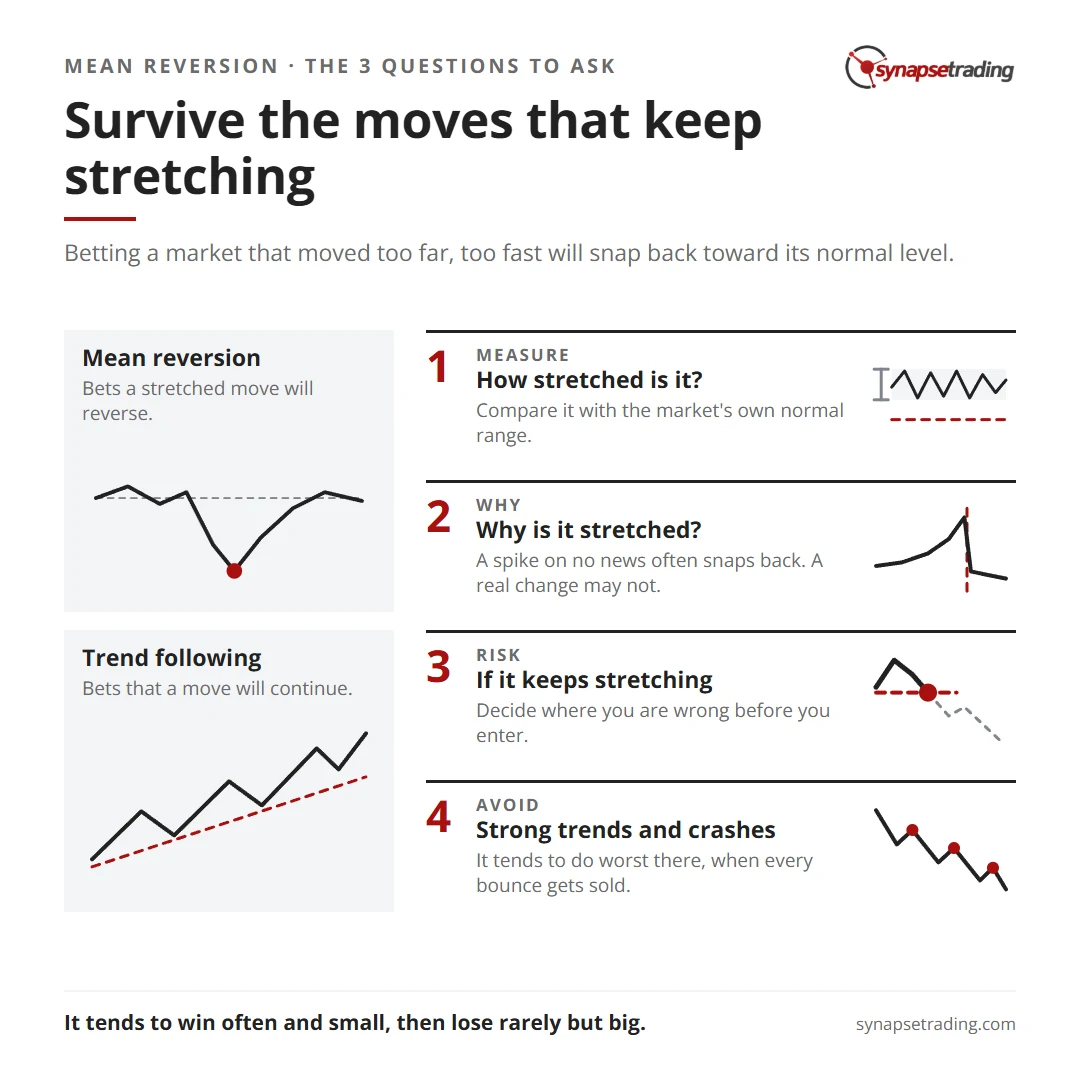
Survive the moves that keep stretching. Summary card for the post: Mean Reversion Trading: How It Works, Why It Wins Often, and How It Loses Big.

What is mean reversion in trading?

Think of a rubber band. Stretch it, and it pulls back toward its resting length. Stretch it too far, and it snaps.

Prices behave a little like that over short periods. After a burst of panic selling there is often nobody left to sell, so price drifts back up, and after a burst of excited buying the buyers run out and price drifts back down. The “mean” is whatever you use for normal: a moving average, the middle of a range, or a band around price.

In our guide to trading strategies, this is the setup type we call Bounce. It is the opposite of trend following, which bets that a move will keep going.

How do traders measure “stretched”?

Most use one of 3 tools.

  1. Bands around an average. Bollinger Bands sit a set distance above and below a moving average. A close outside the band counts as stretched.
  2. Oscillators. The RSI and similar tools read “overbought” or “oversold” when a move has been one-sided for a while.
  3. Distance in units of normal movement. Measure how far price sits from its average, in multiples of the Average True Range. That way “stretched” means the same thing in a calm market as in a wild one.

None of these tells you a move will reverse. They tell you a move is unusual. That is a different and much weaker statement, and confusing the two is how most mean reversion losses begin.

Does mean reversion work? What 26 years of data show

I wanted a number rather than an opinion, so I counted. I took the S&P 500 index from 2000 to 2025 and marked every day it first closed more than 2 Average True Ranges below its 20-day average. That is a sharp, unusual fall. There were 204 such days.

Then I asked what happened next.

After a sharp fall, S&P 500, 2000 to 2025 (204 events)Share of events
Closed at least halfway back to where the 20-day average stood on the day of the fall, within 10 sessionsabout 65%
Closed back above its 20-day average within 10 sessionsabout 53%
Closed more than another 5% lower at some point within 20 sessionsabout 26%
Closed more than another 10% lower at some point within 20 sessionsabout 10%

Do note this is only a count of how often the rubber band pulled back, and it says nothing about whether anyone made money trading those days, because that depends on the entry, the exit and the size.

The pattern is clear enough. Most of the time, the snap-back came. That is why mean reversion strategies tend to have high win rates. But look at the last row. About 1 event in 10 kept falling hard, and all 20 of those came in 6 years: 2001, 2002, 2008, 2009, 2011 and 2020.

Why does mean reversion lose big?

Because the worst losses cluster in the worst markets, exactly when “stretched” keeps getting more stretched.

Three examples from the same count make the point. A sharp fall flagged on 29 September 2008 was followed by a further fall of about 23% within 20 sessions. One flagged on 24 February 2020 was followed by a further fall of about 31%. Another, on 5 March 2020, by about 26%.

A trader buying each of those dips was buying something that looked stretched and then stretched much further, and if the position was large or had no planned exit, one trade like that could erase months of small wins.

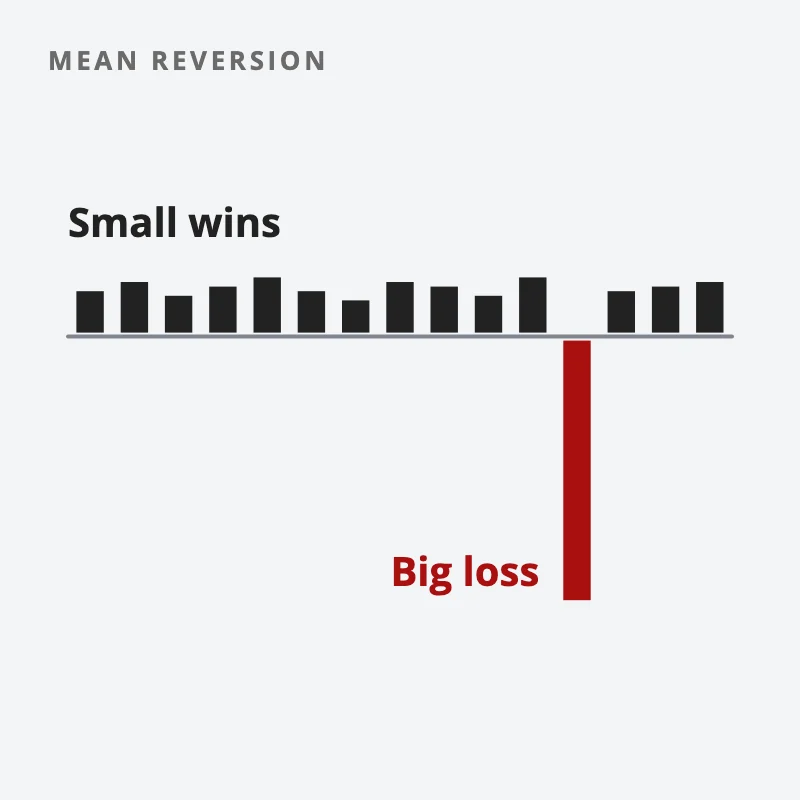
This is the shape of the strategy: many small wins and an occasional large loss. Our post on win rate versus risk reward shows why a high win rate can still lose money. And our post on the risk of ruin shows how quickly a few large losses can end an account.

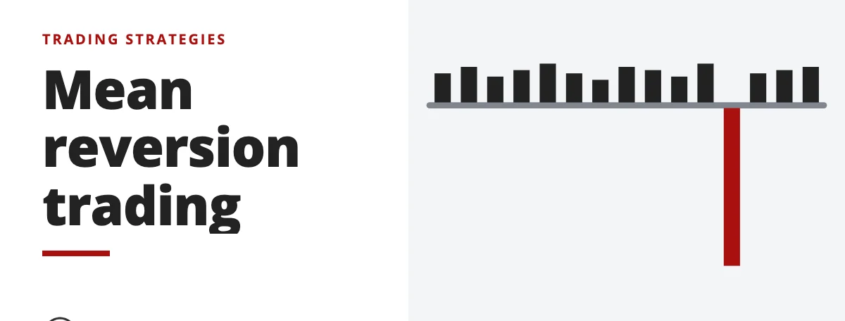
A row of many small winning bars above the line and one large losing bar below it: the shape of a mean reversion strategy
Mean reversion tends to win often and small, then lose rarely but big.

What are the 3 questions to ask before you fade a move?

I call these the 3 questions before you fade. Fading a move means trading against it. I ask all 3 every time, in this order.

  1. How stretched is it? Measure it rather than feel it. A move that “looks big” on a zoomed-in chart can be ordinary on a daily one. Compare it with the market’s own normal range.
  2. Why is it stretched? A spike on no news, or on a one-off headline, is a different animal from a fall caused by a real change, such as a crisis, a rate shock or a broken business. The first often snaps back. The second may be the start of a new trend.
  3. What if it keeps stretching? Decide where you are wrong before you enter, and size the position so being wrong is survivable. Our post on where to put a stop loss covers the thinking.

Personally, I think the third question is the only one that keeps you in business. The first 2 decide whether you take the trade. The third decides whether a bad one hurts you or ends you.

If you want these questions in a short daily routine, they are part of the free checklist at the end of this post.

When does mean reversion work best?

It tends to do best in markets that are going sideways, or in sharp, short spikes inside a calm backdrop. It tends to do worst in strong trends and in crashes, when every bounce gets sold.

That is why it pairs well with trend following. One makes its money when the other is struggling. In our types of trading strategies post, Bounce sits next to Swing, Break and Turn for that reason: each setup type needs a different market.

A related setup is the failed breakout, where price pokes through a level and then snaps back inside. That is mean reversion at a level, covered in false breakouts. And when the whole market turns violent, the rules change again, which is the subject of how to trade a choppy or volatile market.

Is mean reversion right for you?

It suits a certain temperament. If you like being right often, can take profits quickly and can cut a loser without hoping, it can fit. If you tend to “give it more room” when a trade goes against you, it is dangerous, because that habit is exactly what turns a stretched trade into a disaster.

Ask yourself one question. When a dip you bought keeps dipping, do you sell, or do you buy more? Be honest. Your answer says more about whether this strategy suits you than any indicator will.

A rubber band snaps back most of the time. The trader who lasts in mean reversion is the one who has already decided what to do on the day it snaps.

FAQ

What is mean reversion trading?

It is a strategy that bets a market which has moved unusually far from its average will move back toward it. Traders buy after sharp falls or sell after sharp rises, and aim for a modest move back toward normal.

Does mean reversion trading work?

Snap-backs are common. In S&P 500 data from 2000 to 2025, a sharp fall below the 20-day average was followed by at least a halfway recovery within 10 sessions about 65% of the time. Past results do not guarantee future ones, and the losing cases can be large.

What is the win rate of a mean reversion strategy?

Often higher than trend following, because small snap-backs are frequent. A high win rate does not mean profit, though. The occasional large loss can outweigh many small wins.

What is the difference between mean reversion and trend following?

Mean reversion bets that a stretched move will reverse. Trend following bets that a move will continue. They tend to do well in different markets, which is why many traders use both.

Which indicators are used for mean reversion?

Common choices are Bollinger Bands, the RSI and other oscillators, and distance from a moving average measured in Average True Ranges. They show that a move is unusual, not that it will reverse. For the trend side, see the best indicators for swing trading.

Go deeper

The free 15-Minute Swing Trader’s Checklist has the daily routine, the questions to ask before every trade, and the five rules that keep you in the game.


About the author. Spencer Li is The 15-Minute Trader and the founder of Synapse Trading. He is a Certified Financial Technician (CFTe) with 15+ years of trading, run from 70+ countries. He holds a B.Acc and B.BM from SMU. Every trade he takes is public, dated, losses left in. He teaches low-risk swing trading in 15 minutes a day, one system for any market.

Educational content only, not personalised financial advice. Trading carries risk, including loss of capital. Past performance is not indicative of future results. Synapse Trading is not licensed or regulated by MAS.
by Spencer Li
https://synapsetrading.com/wp-content/uploads/2026/10/mean-reversion-trading-card.webp 630 1200 Spencer Li https://synapsetrading.com/wp-content/uploads/2026/10/synapse-logo-horizontal-light.png Spencer Li2026-04-18 13:06:462026-10-22 12:58:29Mean Reversion Trading: How It Works, Why It Wins Often, and How It Loses Big
Page 2 of 12‹1234›»

Free checklist

The 15-Minute Swing Trader’s Checklist

The daily and weekly routine I use to find, manage and review trades in about 15 minutes a day, trading since 2007.

Get the free checklist

Topics

  • Trading foundations
  • Technical analysis
  • Strategies and systems
  • Risk and money
  • Trading psychology
  • Markets and products

Synapse Trading

Swing trading for busy professionals, in 15 minutes a day.

Start free

Learn

  • Start here
  • Free trading guides
  • Blog
  • Tools and resources

Programs

  • Trading Mastery Program
  • Daily trading signals
  • Student results
  • Public trade log

Company

  • About
  • Contact me
  • Partnerships
  • Disclaimer
  • Privacy policy
  • Terms & Conditions

Synapse Trading Pte Ltd
Registration No. 201316168H
WhatsApp +65-8897-1204
info@synapsetrading.com

Contact Us

Synapse Trading Pte Ltd
Registration No. 201316168H

Whatsapp: +65-8897-1204
Telegram: @iamrecneps
Email: info@synapsetrading.com

Links

Disclaimer
Privacy policy
Terms & Conditions
Contact us
Partnerships

© 2012-2026 Synapse Trading | All rights reserved. Educational content only, not personalised financial advice. Trading carries risk, including loss of capital. Past performance is not indicative of future results. Synapse Trading is not licensed or regulated by MAS.
  • Link to Facebook
  • Link to X
  • Link to Instagram
  • Link to Youtube
  • Link to LinkedIn
  • Link to Mail
Scroll to top Scroll to top Scroll to top