

Should You Wait for the Candle to Close? Why the Close Is the Price That Counts
Want the daily routine? Get the free 15-Minute Swing Trader’s Checklist. Get it free →
Last updated: 16 October 2026 · By Spencer Li, CFTe
Yes. For most swing traders, waiting for the candle to close is the better habit. The close is the price the market settled on after a full period of buying and selling, while a mid-candle price is only where the fight stood at that moment.
Here is the evidence I found. On the S&P 500, from 2000 to 2025, there were 1,386 days when price traded above its highest point of the previous 20 days. About 42% of those days closed back below that level. On gold it was about 34%. A trader who acted at the moment of the break was wrong-footed roughly 1 time in 3 to 2 times in 5, and the close would have told him so the same evening.
Waiting has a cost too. You give up a little price, and occasionally a move. In this post, I’ll show you both sides, with the numbers.
Why does the close matter more than the high?
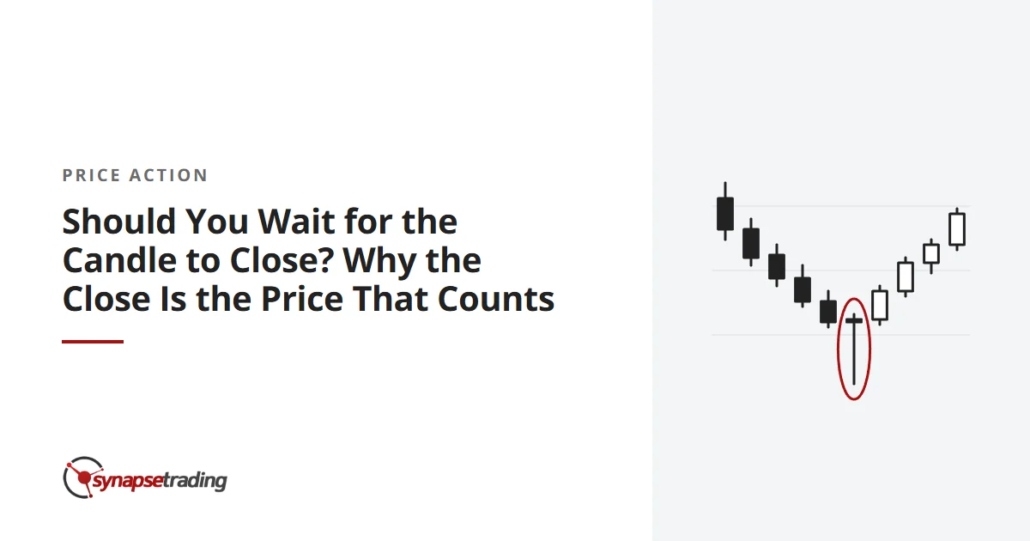
Picture a stock pushing through a ceiling at lunchtime. The screen turns green, the breakout looks clean, and a few people buy. By the close, sellers have pushed it back down, and the candle finishes below the ceiling with a long upper wick.
The high of that candle was real. Someone did trade there. But the close is where the whole day’s argument between buyers and sellers finally settled, after the news, the lunchtime excitement and the late selling had all been absorbed, and on that day the sellers won.
That is why our price action trading guide puts it as Layer 4, the candle that commits you, and its one rule is to decide on closed candles. Our post on how to read a price bar shows how the open, high, low and close fit together inside one candle.
How often does a break fail by the close?
I wanted to see how much of this is folklore, so I tested it. I took 2 markets with long daily histories, the S&P 500 index and gold, and used one simple level: the highest high of the previous 20 sessions. Then I asked 2 questions about every day that traded above that level.
- Did the day close back at or below the level?
- On the days that did close above, how much higher than the level was the close?
| Market, 2000 to 2025 | Days that traded above the 20-day high | Closed back at or below it | Median close above the level, when it held |
| S&P 500 index | 1,386 | about 42% | about 0.3% |
| Gold | 1,001 | about 34% | about 0.5% |
[INFOGRAPHIC: 2 bars per market, “poked above” vs “closed above”, with the failed share shaded and labelled]
Read the 2 columns together, because they are the whole trade-off.
The third column is what waiting saves you. On the index, more than 4 in 10 of those breaks were gone by the close. Anyone who bought the moment price poked through was holding a position the market had already rejected.
The last column is what waiting costs you. When the break was real, the close was usually only a little above the level, about 0.3% on the index and 0.5% on gold. That is roughly a third to a half of a normal day’s range. So the price you give up for patience is small next to the share of fake breaks it filters out.
Do note the limits. This is 2 markets, 1 level and daily candles, and a different level would give different numbers. What I would expect to hold across settings is the shape: a large share of intraday breaks fail by the close, and the real ones usually close only a little beyond the level.
Poke or close: what are you actually looking at?
I find it helps to give the 2 events different names, so you never confuse them. A poke is price trading beyond a level during the candle. A close is the candle finishing beyond it.
A poke is a question. A close is the market’s answer.
A common painful trade is a poke treated as a close. The trader buys the poke above resistance, the candle closes back inside, and the next morning he is holding a failed breakout with no plan. Their stop-entry orders make it worse, because a buy-stop just above a level fills on the poke, before anyone knows how the day will end.
If you want a routine for reading the close, the 15 minutes I spend after it are in the free checklist at the end of this post.
When does waiting for the close cost you?
There are 3 honest costs, and you should know them before you adopt the rule.
- A worse price. On a real break, you buy higher than the level. In the test above, that gap was usually a fraction of a day’s range.
- The occasional runaway. Some breakouts close far above the level, and some keep going the next morning without looking back. You will miss a few of those, and that will hurt.
- Gaps overnight. If you decide at the close and act the next session, price can open somewhere else entirely. That risk comes with holding through the night, and it is part of swing trading.
Is it ever right to act before the close? For some styles, yes. Day traders work on 5-minute or 15-minute candles, and each of those closes many times a day. The principle is the same, only the candle is shorter. Our comparison of swing trading versus intraday trading covers which rhythm fits which life.
Does the closing candle rule apply to exits too?
It applies to judgement. If your reading of a trade was “this level should hold”, the close is the fairest test of whether it did. A wick through the level at lunchtime that closes back above it has not proven you wrong.
But be careful with this. A close-based decision is a judgement made once a day, and a market can fall a long way before the close. Many traders keep a protective stop in the market for the disaster case, and use the close for everything else. How you set that stop is its own subject, covered in where to put your stop loss and take profit.
Why does this suit people with jobs?
On a daily chart, the candle closes once a day, so you can read it in the evening, with the whole day’s information already inside the candle and no screen to stare at while you are supposed to be working.
Personally, I read mine after the close, in about 15 minutes, and most days the answer is to do nothing. The close takes the most stressful part of trading, the intraday flicker, and removes it from the decision. You cannot be shaken out by a lunchtime spike you never saw.
It also stacks with the other layers. A close above a broken level is the “hold” in role reversal. A close below the last higher low is the first warning in market structure. And the close is the first filter for false breakouts. Candlestick patterns depend on it too, because a pattern that has not closed is not yet a pattern, one of the points in the wrong way to trade candlestick patterns.
Go back to the lunchtime breakout. The buyer who waited until the evening saw the long upper wick, closed the chart, and went to dinner with nothing to fix.
FAQ
Should you wait for the candle to close before entering a trade?
For swing traders, usually yes. In a test on 26 years of daily data, about 42% of moves above a 20-day high on the S&P 500 closed back below it the same day. Waiting for the close filtered those out at a small cost in price.
What is a candle close confirmation?
It means acting only after a candle has finished beyond a level, rather than when price first trades through it. The close shows where buyers and sellers settled after the whole period.
What does it cost to wait for the close?
A slightly worse price on real breaks, and the occasional move that runs away without you. In the test above, the close on a real break sat a median of about 0.3% above the level on the S&P 500 and about 0.5% on gold.
Does waiting for the close work on lower timeframes?
The principle is the same on any timeframe, since every candle has a close. Shorter candles close more often, so you get more signals and more noise, and you need to be at the screen.
What is a wick through support or resistance?
It is a part of the candle that traded beyond the level and was pushed back before the close. A wick through a level with a close back inside often means the break was rejected.
Go deeper
The free 15-Minute Swing Trader’s Checklist has the daily routine, the questions to ask before every trade, and the five rules that keep you in the game. Enter your email and we’ll send it over:
We use your email address to send you the checklist, then emails about trading and our courses. Unsubscribe any time. Privacy policy.
About the author. Spencer Li is the founder of Synapse Trading and a Certified Financial Technician (CFTe). His trade log is public: every trade since April 2024, dated, losses left in.
Educational content only, not personalised financial advice. Trading carries risk, including loss of capital. Past performance is not indicative of future results. Synapse Trading is not licensed or regulated by MAS.
Want the daily routine? Enter your email for the free 15-Minute Swing Trader's Checklist.
Free 5-page PDF, then occasional trading emails. Education only, not financial advice. Unsubscribe anytime. Kit stores your email in the US: see our privacy policy.
Want to learn the full method? The Trading Mastery Program teaches the 4 strategies I have traded since 2011. It suits beginners and experienced traders.
Rather follow the trades as they happen? Daily Trading Signals is our Telegram channel: my trade ideas with entry, stop and exit, and every trade is public.
Educational content only, not personalised financial advice. Trading carries risk, including loss of capital. Past performance is not indicative of future results. Synapse Trading is not licensed or regulated by MAS.


Leave a Reply
Want to join the discussion?Feel free to contribute!