

Double Top and Double Bottom Patterns: How to Tell a Real One From an Early Guess
Want the daily routine? Get the free 15-Minute Swing Trader’s Checklist. Get it free →
Last updated: 16 October 2026 · By Spencer Li, CFTe
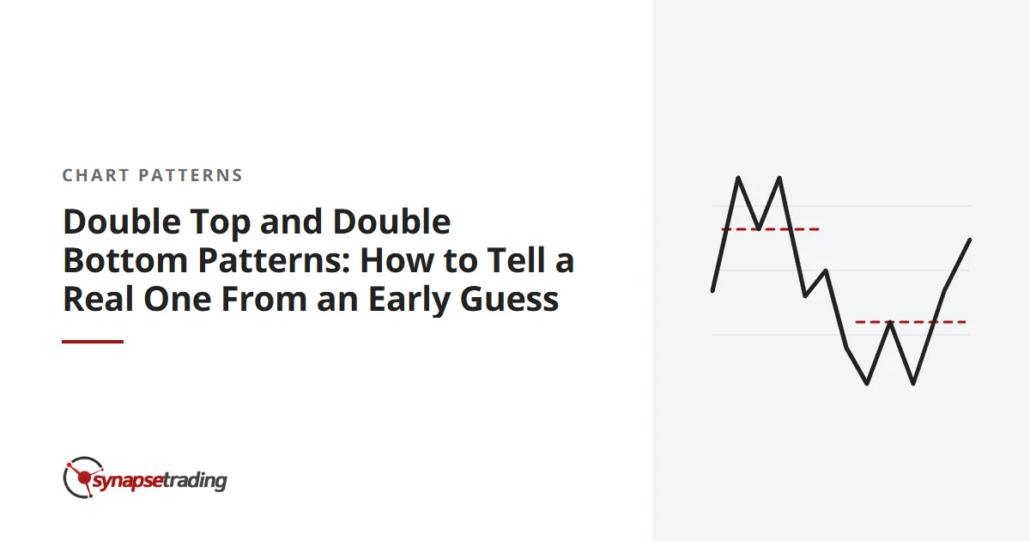
A double top is a bearish reversal pattern: the price rises to a high, pulls back, rallies to roughly the same high again, and fails. It looks like the letter M. A double bottom is the mirror image, a W, and it is a bullish reversal pattern.
Most beginners miss one detail. Two peaks at the same level do not make a double top. The pattern is only complete when the price closes below the low point between the 2 peaks, a level called the neckline. For a double bottom, it completes when the price closes above the high point between the 2 lows.
Until that happens, what you are looking at is an early guess, however convincing the 2 peaks look and however many people on social media are already calling it a top. The rest of this post is about telling the two apart.
What does a double top look like?
Picture a stock in a healthy uptrend. It climbs to 50, then pulls back to 44. Then it rallies again, all the way back to around 50, and stalls. Now the chart has 2 peaks and a valley, and the shape starts to look like an M.
The valley low at 44 is the neckline. If the price later closes below 44, the double top is complete. The buyers have tried twice to push through 50 and failed twice, and the low that held between the attempts has now given way.
A double bottom works the same way, upside down. A falling stock drops to a low, bounces, falls back to roughly the same low, and holds. It completes when the price closes above the peak of the bounce in between.
| Double top | Double bottom | |
| Shape | M | W |
| Comes after | an uptrend | a downtrend |
| Neckline | the low between the 2 peaks | the high between the 2 lows |
| Complete when | the price closes below the neckline | the price closes above the neckline |
| Usual meaning | the uptrend may be ending | the downtrend may be ending |
Why does a double top form?
The pattern is a story about 2 groups of people. On the first push to 50, the early buyers take profits and the rally stalls. As the price falls, the traders who bought near the top start to feel trapped and anxious.
Then the price climbs back towards 50, and those trapped buyers feel relief. Many of them promised themselves they would get out if they ever got their money back, and now they can. Alexander Elder describes this crowd as waiting with sell orders at the old high for their “second chance”. Their selling, plus fresh profit-taking, stops the second rally.
So the second peak is a test as much as a price level: it is the moment the market finds out whether the buyers have enough energy left to absorb everyone who wants out. If they do not, the price falls back, and when it breaks the neckline, the people who bought on the second rally are trapped too.
Why are so many double tops just early guesses?
Because 2 peaks at a similar level show up all the time, and most of them are just a pause inside a trend that carries on. Martin Pring, who wrote a whole book on price patterns, argues that true double tops are rare, and that many shapes that look like one turn into continuation patterns instead.
That is the trap. You see the second peak, you feel clever for spotting the M, and you act before the neckline breaks. Then the price pushes straight through the old high, the shorts who jumped in early scramble to buy back, and the “double top” you were so sure of becomes the launch pad for a breakout instead. The fear of missing the reversal is what makes this mistake so tempting, and so costly.
Edwards and Magee, whose 1948 book defined most of these patterns, add a second warning: “a Reversal Pattern has to have something to reverse.” A double top after a small rise has little to reverse, so even a completed pattern may lead to only a small move.
If you want a daily routine that keeps you from acting on early guesses, the free 15-Minute Swing Trader’s Checklist is at the end of this post.
How do you confirm a double top or double bottom?
I use 3 confirmations, in this order:
- A close through the neckline. A candle has to close beyond the neckline, not just poke through it and snap back. Until then, the pattern does not exist.
- Volume that tells the same story. On a double top, the second peak usually comes on lighter volume than the first, a sign the buyers are tiring. On a double bottom, the classic signature is heavy volume on the first low, lighter volume on the second, and expanding volume on the breakout.
- A retest that holds. After the break, the price often comes back to the neckline. For a double top, the old support should now act as resistance. If the price climbs back above the neckline and stays there, the pattern has failed.
[INFOGRAPHIC: an M and a W side by side, with the neckline drawn, the 3 confirmations numbered on each (close through, volume bars, retest), and a crossed-out early entry at the second peak]
In my own trading, reversals are a small part of what I do and they carry the highest bar of any setup I take. One line in my own trading playbook reads: “easier to make money from strong up-trends than to buy reversals”. And another rule in the same playbook covers exactly this pattern: if the neckline has not broken, I do not anticipate it.
What is the price target for a double top?
The usual method is to measure the height of the pattern, from the peaks down to the neckline, and project that distance from the point where the neckline breaks.
Back to our example. The peaks are at 50 and the neckline is at 44, so the pattern is 6 points tall. If the price closes below 44, the rough target is 44 minus 6, which is 38. For a double bottom, you add the height to the breakout point instead.
Do note the cap that Edwards and Magee attached to reversal targets. A reversal cannot be counted on to move further than the trend it is reversing. If the stock only climbed from 45 to 50 before forming the pattern, a target of 38 is probably asking too much. The smaller of the 2 numbers is the safer guide. For how pattern targets fit with stops and support levels, see where to put your stop loss and take profit.
How is a double top different from a head and shoulders?
They are close relatives. A head and shoulders has 3 peaks, with the middle one highest, while a double top has 2 peaks at roughly the same height. Three peaks at roughly the same height make a triple top. All of them work on the same idea: a level the buyers fail to break, then a neckline that gives way.
The head and shoulders pattern has its own post, and our post on continuation and reversal patterns explains how to tell which family a shape belongs to. A related reversal shape with sloping lines is the rising wedge, covered in rising and falling wedge patterns. The full family lives in the price chart patterns guide.
Personally, I think the double top teaches patience better than any other pattern. The M is easy to see and hard to wait for. Every instinct says the second peak is the moment, when in fact it is only the question.
That stock sitting at 50 for the second time is asking whether the buyers have anything left. The neckline is where you get the answer.
FAQ
What is a double top pattern?
It is a bearish reversal pattern shaped like an M. The price makes 2 peaks at roughly the same level with a valley between them, and the pattern completes when the price closes below the valley low, called the neckline.
What is a double bottom pattern?
It is the bullish mirror image, shaped like a W. The price makes 2 lows at roughly the same level, and the pattern completes when the price closes above the high between them.
Is a double top bullish or bearish?
Bearish. It suggests an uptrend may be ending. A double bottom is bullish and suggests a downtrend may be ending.
How do you confirm a double top?
Wait for a candle to close below the neckline, check that volume was lighter on the second peak, and watch whether a retest of the neckline holds as resistance.
How do you calculate the target of a double top?
Measure the height from the peaks to the neckline and project it down from the breakout point. Treat it as a rough guide, and remember that a reversal cannot be counted on to move further than the trend it reversed.
Go deeper
The free 15-Minute Swing Trader’s Checklist has the daily routine, the questions to ask before every trade, and the five rules that keep you in the game. Enter your email and we’ll send it over:
We use your email address to send you the checklist, then emails about trading and our courses. Unsubscribe any time. Privacy policy.
About the author. Spencer Li is the founder of Synapse Trading and a Certified Financial Technician (CFTe). His trade log is public: every trade since April 2024, dated, losses left in.
Educational content only, not personalised financial advice. Trading carries risk, including loss of capital. Past performance is not indicative of future results. Synapse Trading is not licensed or regulated by MAS.
Want the daily routine? Enter your email for the free 15-Minute Swing Trader's Checklist.
Free 5-page PDF, then occasional trading emails. Education only, not financial advice. Unsubscribe anytime. Kit stores your email in the US: see our privacy policy.
Want to learn the full method? The Trading Mastery Program teaches the 4 strategies I have traded since 2011. It suits beginners and experienced traders.
Rather follow the trades as they happen? Daily Trading Signals is our Telegram channel: my trade ideas with entry, stop and exit, and every trade is public.
Educational content only, not personalised financial advice. Trading carries risk, including loss of capital. Past performance is not indicative of future results. Synapse Trading is not licensed or regulated by MAS.


Leave a Reply
Want to join the discussion?Feel free to contribute!