

Best Forex Price Chart Patterns
Want the daily routine? Get the free 15-Minute Swing Trader’s Checklist. Get it free →
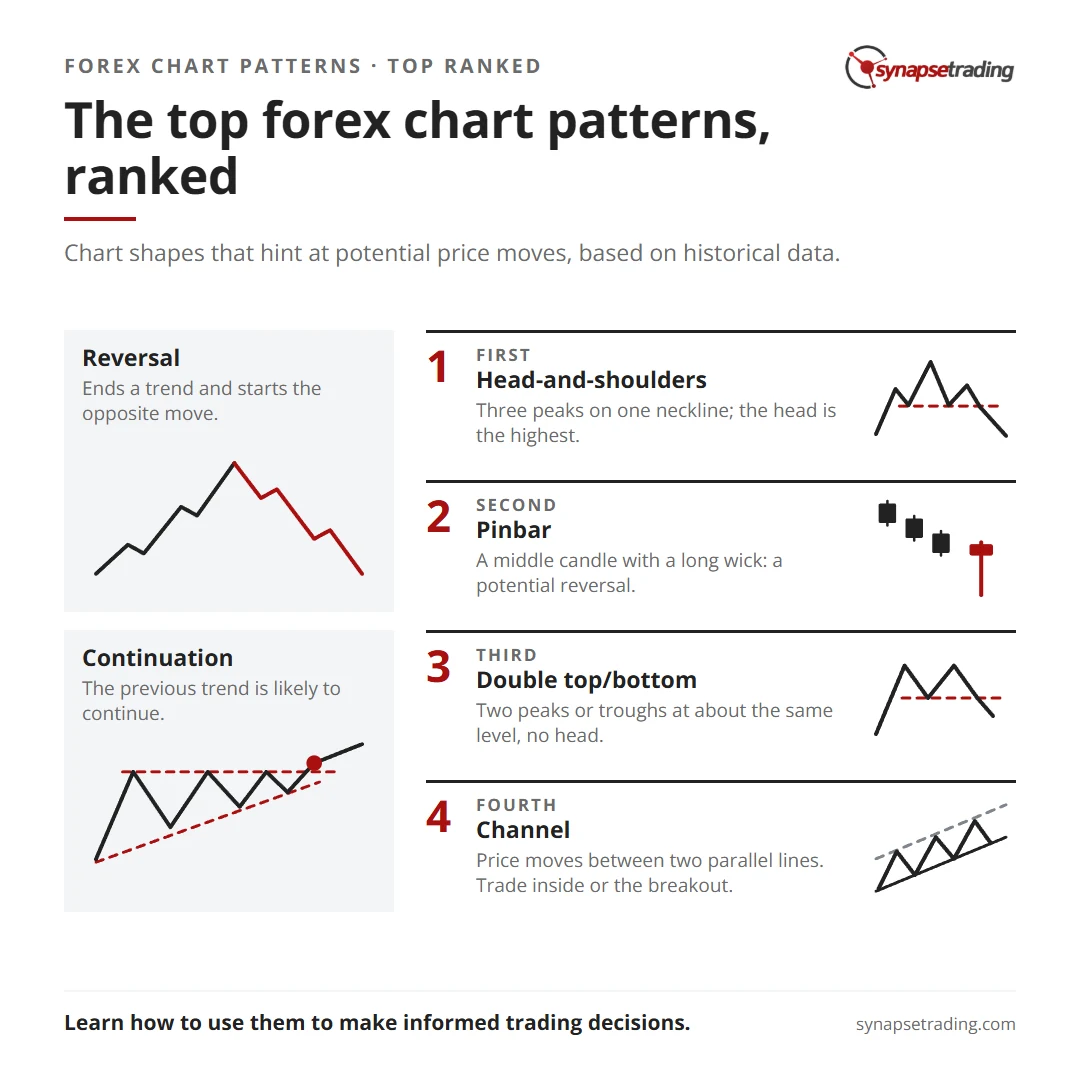
Forex chart patterns are crucial tools for traders in the forex market, offering insights into potential price movements based on historical data. These patterns are widely used by both beginners and experienced traders to identify trading opportunities and enhance their trading strategies. Below are some of the best forex chart patterns, ranked according to their popularity and effectiveness.
Top Forex Chart Patterns Ranking
1. Head-and-Shoulders
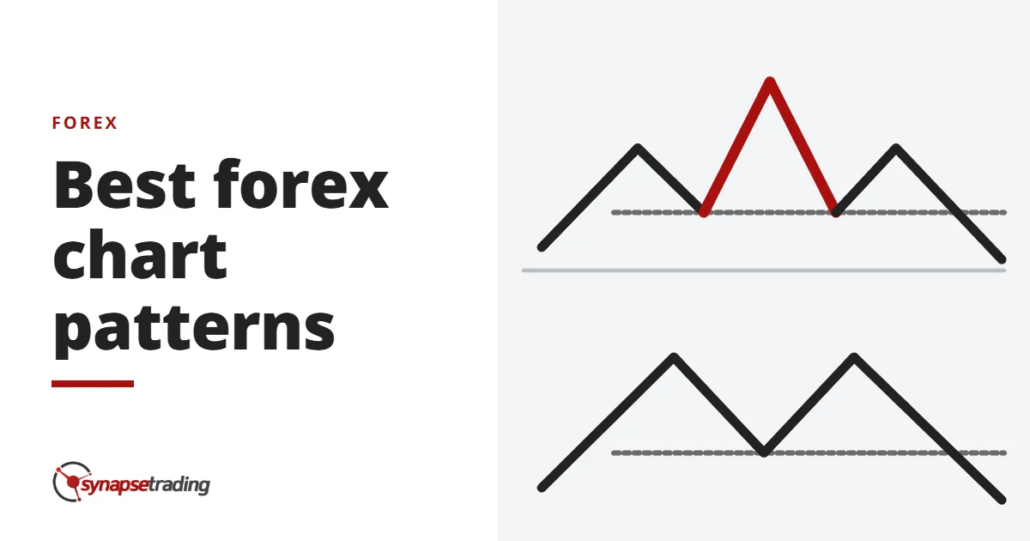
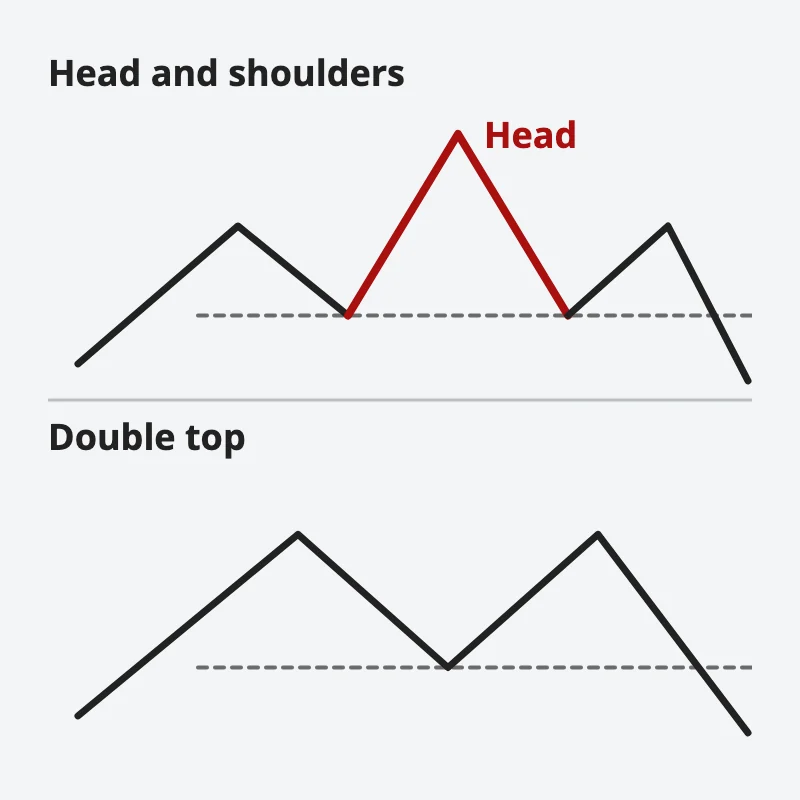
The head-and-shoulders pattern is one of the most recognized trend-reversal patterns. It appears at the top or bottom of a trend and consists of three peaks: a left shoulder, a head (the highest peak), and a right shoulder. These peaks should share the same neckline. This pattern often signals the end of a trend and the start of an opposite movement.
2. Pinbar
The Pinbar pattern is a three-candlestick formation, where the middle candlestick (the pinbar) has a long wick, indicating a potential reversal. The first and third candlesticks are referred to as the “left eye” and “right eye,” respectively. The pinbar pattern is popular due to its reliability in indicating potential market reversals.
3. Double Top/Bottom
The double top/bottom pattern is a trend-reversal pattern that resembles the head-and-shoulders but lacks the “head” peak. It forms two peaks or troughs at approximately the same level, signaling a potential reversal in the current trend.
4. Channel
A channel pattern forms when the price moves between two parallel lines, representing support and resistance levels. Channels can be horizontal, ascending, or descending. Traders use this pattern to trade within the channel or to anticipate breakouts.
5. Triple Top/Bottom
The triple top/bottom pattern is similar to the double top/bottom but with three peaks or troughs. This pattern is considered more reliable and indicates a stronger potential reversal.
6. Bearish/Bullish Engulfing
The bearish or bullish engulfing pattern occurs when a smaller candlestick is completely engulfed by a larger one, signaling a potential reversal. A bearish engulfing pattern appears at the end of an uptrend, while a bullish engulfing pattern appears at the end of a downtrend.
7. Ascending/Descending Triangle
The ascending/descending triangle is a continuation pattern that forms when the price action creates a horizontal resistance line (ascending triangle) or support line (descending triangle) along with an ascending or descending trendline. This pattern suggests that the previous trend is likely to continue.
8. Shooting Star and Bullish Hammer
The shooting star and bullish hammer are reversal patterns found at the end of an uptrend or downtrend, respectively. The shooting star has a long upper wick, a small body, and little to no lower wick. The bullish hammer has a long lower wick, a small body, and little to no upper wick.
9. Symmetrical Triangles
Symmetrical triangles are continuation patterns formed by two converging trendlines, one ascending and the other descending. This pattern indicates a period of consolidation before the price continues in the direction of the prior trend.
10. Evening/Morning Star
The evening and morning star patterns are three-candlestick formations that signal a reversal. An evening star appears at the end of an uptrend and consists of a long bullish candle, a small-bodied candle, and a long bearish candle. A morning star is the inverse, signaling a reversal at the end of a downtrend.
11. Wedge
A wedge pattern can indicate a potential reversal and is formed by two converging trendlines that slope in the same direction. Unlike triangles, both trendlines in a wedge pattern move either upward or downward.
12. Evening/Morning Doji Star
The evening and morning doji star patterns are similar to the evening/morning star patterns but with a doji as the middle candle. A doji indicates indecision in the market, making these patterns more reliable for predicting reversals.
13. Gap
A gap occurs when there is a significant difference between the closing price of one candlestick and the opening price of the next. Gaps can signal strong momentum in the market, and traders often expect the price to “fill” the gap by moving back to the previous level.
14. Inside Bar
An inside bar is a two-candlestick pattern where the second candle is completely contained within the range of the previous candle. This pattern often indicates a potential reversal, especially when it occurs after a strong trend.
15. Dark Cloud and Piercing Line
The dark cloud and piercing line are two-candlestick patterns that signal a reversal. The dark cloud cover appears at the end of an uptrend, while the piercing line appears at the end of a downtrend.
16. Cup and Handle
The cup and handle pattern is a continuation pattern that resembles a teacup. It forms a U-shaped bottom (or top in an inverted version) followed by a short-term correction. This pattern is considered reliable but occurs infrequently.
17. Hikkake
The hikkake pattern is a failed inside bar pattern that consists of two bars. It is used to identify false breakouts and can sometimes be a powerful reversal signal.
18. Diamond
The diamond pattern is a reversal pattern that resembles a diamond shape on the chart. It is formed by a combination of two converging trendlines, similar to a symmetrical triangle, but with a wider middle section.
19. Horn
The horn pattern is a rare reversal pattern characterized by two prominent peaks or troughs that resemble the letter “H.” It is considered a significant reversal signal by some traders.
Concluding Thoughts
Forex chart patterns are essential tools that can provide valuable insights into potential market movements. Understanding these patterns and how to use them effectively can significantly enhance a trader’s ability to predict market behavior and make informed trading decisions. Whether you’re a beginner or an experienced trader, mastering these chart patterns is crucial for success in the forex market.
Want the daily routine? Enter your email for the free 15-Minute Swing Trader's Checklist.
Free 5-page PDF, then occasional trading emails. Education only, not financial advice. Unsubscribe anytime. Kit stores your email in the US: see our privacy policy.
Want to learn the full method? The Trading Mastery Program teaches the 4 strategies I have traded since 2011. It suits beginners and experienced traders.
Rather follow the trades as they happen? Daily Trading Signals is our Telegram channel: my trade ideas with entry, stop and exit, and every trade is public.
Questions about this post? Ask in the free Telegram channel →
Educational content only, not personalised financial advice. Trading carries risk, including loss of capital. Past performance is not indicative of future results. Synapse Trading is not licensed or regulated by MAS.

