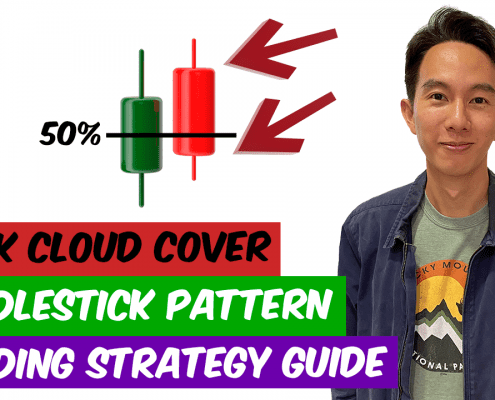
The Dark Cloud Cover Candlestick Pattern is a bearish candlestick pattern that is typically formed after an uptrend and indicates a potential trend reversal.It is characterized by the following:A long white candlestick
A short…
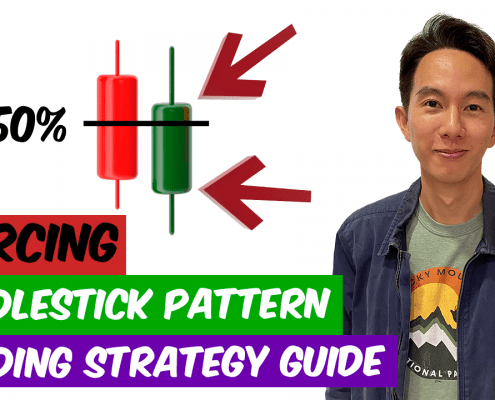
The Piercing Pattern is a bullish candlestick pattern that is typically formed after a downtrend and indicates a potential trend reversal.It is characterized by the following:A long black candlestick
A short white candlestick…
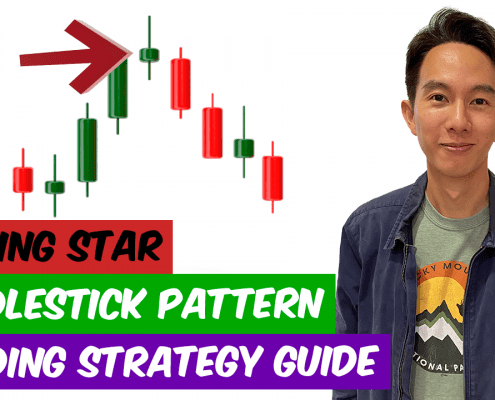
The evening star candlestick pattern is a bearish reversal pattern that appears after an uptrend in a financial security's price.It is characterized by a long upper shadow, which indicates that buyers tried to push the price higher but…
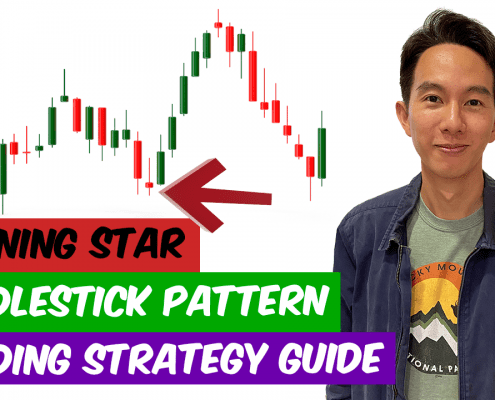
The morning star candlestick pattern is a bullish reversal pattern that appears after a downtrend in a financial security's price.It is characterized by a small real body, which suggests that there was little trading activity…
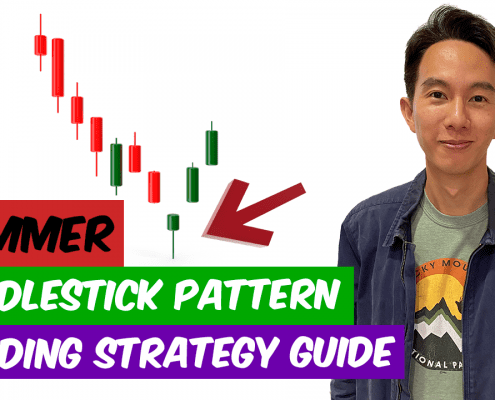
The hammer candlestick pattern is a bullish reversal pattern that consists of a single candlestick with a small body and a long lower shadow.It is called a "hammer" because it looks like a hammer with the handle being the small…
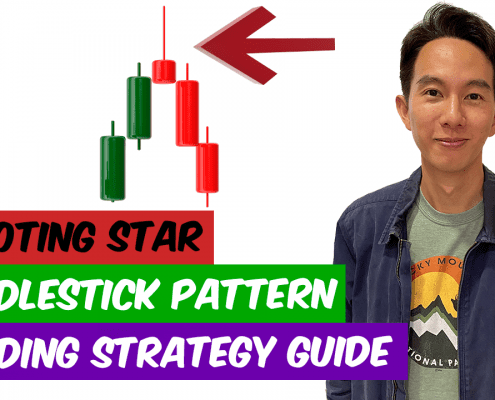
The shooting star candlestick pattern is a bearish reversal pattern that appears after an uptrend in a financial security's price.It is characterized by a long upper shadow, which indicates that buyers tried to push the price higher…
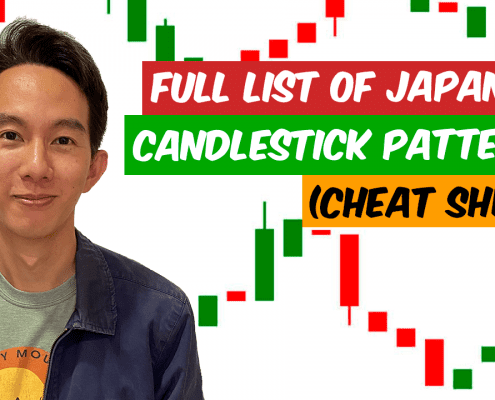
There are many different candlestick patterns that can be used in technical analysis to interpret price data and make trading decisions.
Bullish vs. Bearish Candlestick Patterns
Bullish and bearish candlestick patterns are used…
https://synapsetrading.com/wp-content/uploads/2022/12/Thumbnail-Full-List-of-Japanese-Candlestick-Patterns-Cheat-Sheet.png7201280Spencer Lihttps://synapsetrading.com/wp-content/uploads/2019/10/logo.jpgSpencer Li2022-12-21 02:10:502023-01-10 01:48:42Full List of Japanese Candlestick Patterns (Cheat Sheet)
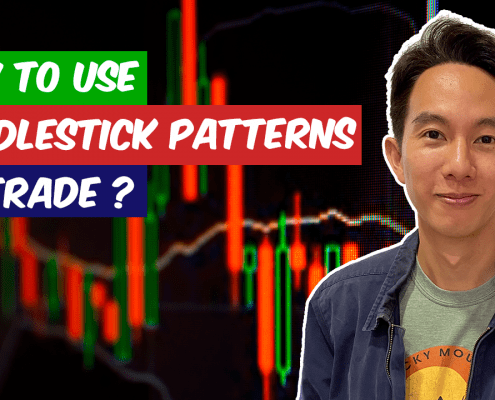
Candlestick patterns are a type of chart pattern used in technical analysis to interpret price data and make trading decisions. These patterns are named after the shape of the candlestick chart that they form and can provide valuable insights…
https://synapsetrading.com/wp-content/uploads/2022/12/Thumbnail-What-are-Candlestick-Patterns-and-How-to-Use-them-to-Trade.png7201280Spencer Lihttps://synapsetrading.com/wp-content/uploads/2019/10/logo.jpgSpencer Li2022-12-21 02:04:452023-01-10 01:49:02What are Candlestick Patterns and How to Use them to Trade?
Wondering what the deal is with inflation and how it affects the economy?No worries, we've got you covered.Inflation is when the overall price of stuff goes up over time, which means the same amount of money can buy less.There…
https://synapsetrading.com/wp-content/uploads/2022/12/Thumbnail-How-to-Profit-from-Inflation.png7201280Spencer Lihttps://synapsetrading.com/wp-content/uploads/2019/10/logo.jpgSpencer Li2022-12-20 22:46:542023-02-08 18:24:42How to Profit from Inflation? (With 33 Types of Asset Investments)