

How to Spot a Trend Reversal Early: the Warning Signs and the Odds
Want the daily routine? Get the free 15-Minute Swing Trader’s Checklist. Get it free →
The signs show up before the trend breaks. The hard part is that most of them are false alarms
Published: 17 October 2026 · Last updated: 17 October 2026 · By Spencer Li, CFTe
A trader posted a chart with a red circle marking where they bought, just before the trend turned against them. The caption: “All indicators didnt show a weakening trend.”
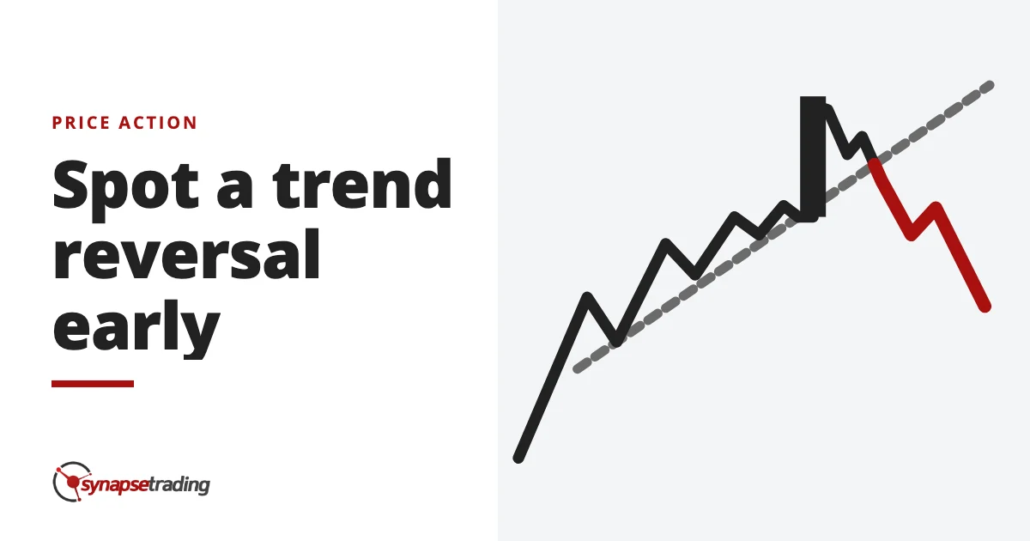
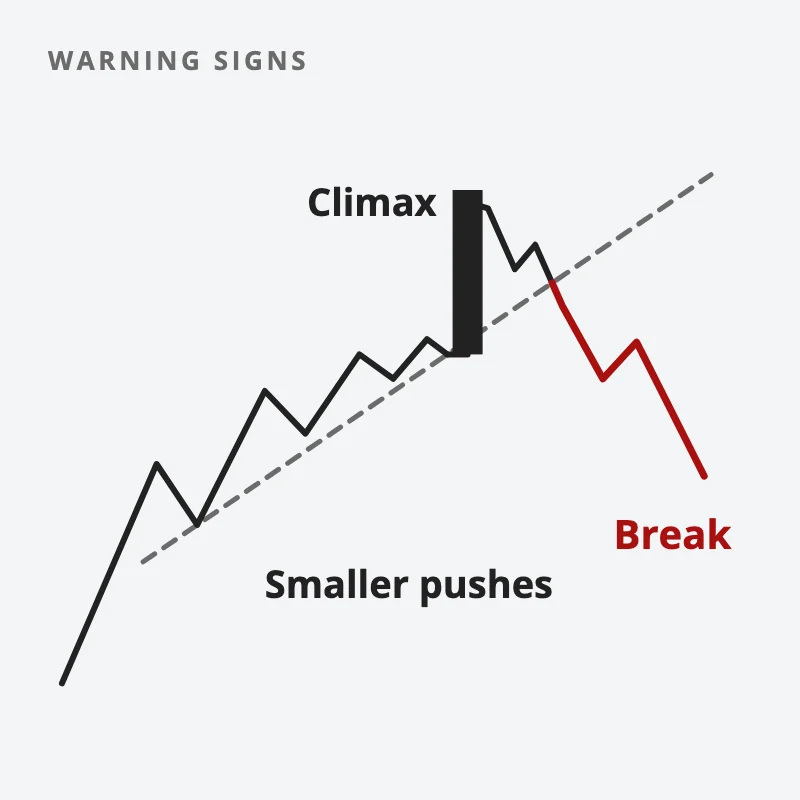
That is the problem with spotting reversals early. Most indicators are built from past prices, so they confirm a turn after it has happened. The earliest warnings come from price itself: the pushes in the trend get smaller, a climax bar appears, and then the trendline breaks. Those 3 signs tend to come in that order.
But here is the honest part. Most reversal attempts fail. Al Brooks, who wrote a full book on reversals, puts it bluntly: “The single most important thing to remember is that most trend reversal attempts fail.” By his estimate, about 80% of them do, and the trend carries on.
So the warning signs are worth reading. But they are a reason to protect what you have, well before they are a reason to trade the other way.
Why do most trend reversals fail?
Because a trend has momentum, and momentum resists change. Brooks compares a trend to a huge ship. It takes a lot of force, over a lot of time, to turn it around.
He goes further: “There is really no such thing as a trend reversal pattern. When there is a trend, all patterns are continuation patterns, but occasionally one will fail.”
That changes how you read a chart. A double top in an uptrend is, most of the time, just a pause before the next leg up. Brooks makes the same point about topping patterns: “As happens in 80 percent of topping patterns, the market broke to the upside and the bears learned once again that most tops are just bull flags.”
And even when a reversal does succeed, the usual result is a sideways range rather than a strong trend the other way. For a well-formed major reversal, Brooks puts the chance of a profitable swing at only 40% to 50%. He estimates that about 70% of the time, the outcome is a trading range.
Do note that this is good news if you trade with the trend. Every failed reversal is a trend that kept going.
What are the early warning signs of a trend reversal?
Here are the 3 stages, using an uptrend as the example. A downtrend is the mirror image.
Stage 1: The pushes get smaller. In a healthy uptrend, each push to a new high is strong and goes well past the last one. As the trend tires, the new highs barely clear the old ones. Brooks calls this pattern shrinking stairs, and he reads it as waning momentum with higher odds of a correction. Pullbacks also tend to get deeper and last longer, and the candles start overlapping instead of stacking cleanly.
A special case is 3 pushes up. After a third push, Brooks writes, “a third consecutive reversal is usually enough” for the sellers to take control for a while. This is the same idea behind rising and falling wedges.
Stage 2: A climax appears late in the trend. A climax is a move that has gone too far, too fast. On a chart it often looks like the biggest bullish bar of the whole trend, appearing after a long run. It feels like strength. But Brooks found that when a long trend produces its biggest bar yet, the odds of follow-through are lower. In his words, “sometimes the strongest breakout attempts are the most likely to fail.” 2 or 3 climaxes in a row, with little pullback between them, raise the odds of a correction further.
Stage 3: The trendline gives way. This is the one Brooks treats as required. A reversal needs a break of the trendline from the prior trend, and usually of the moving average too. His rule is firm: “You should never be thinking about trading against a trend until after there has been a breakout of the channel.” Even then, the break is only the first sign that sellers are getting stronger. Price usually comes back to test the old high before anything is settled.
If you want a short daily routine for reading charts like this before you act, our free 15-Minute Swing Trader’s Checklist covers it. Get the free checklist →
How much is each warning sign worth?
Each sign on its own is weak. The order they come in matters more than any single one.
| Warning sign | What you see on the chart | What it suggests | Sensible response |
| Shrinking pushes | New highs that barely clear the last ones, deeper pullbacks, overlapping candles | Buyers are losing urgency | Stop adding to the position |
| 3 pushes | A third push to a new high that fails to run | A pause or pullback is likely | Watch for a break of the trendline |
| Late climax bar | The biggest bar of the trend, late in the move | Possible exhaustion | Consider taking partial profit |
| Trendline break | A close below the rising trendline and the moving average | Sellers are gaining strength | Tighten the stop on the remaining position |
| Failed test | A rally back to the old high that stalls and turns down | The reversal case is building | Hand over to the structure check |
After the last row, the job moves to market structure. That is where a close below the last higher low, then a lower high and a lower low, turn a warning into evidence.
The failed test often takes the shape of a double top or a head and shoulders. Brooks has a neat line for why that second attempt matters: “Whenever the market tries twice to do something and fails, it usually tries the opposite.”
Should you trade a reversal or wait for confirmation?
For most swing traders, waiting is the better trade. Brooks explains why early reversal trades are so tempting: “Channels always look like they are about to reverse, suckering traders into countertrend trades.” A trend that has run a long way looks stretched, and stretched looks like it should snap back.
But think about the cost of being early. You are betting against the direction most of the market is moving. If about 80% of attempts fail, most early calls end up on the wrong side of the trend, and a string of small losses adds up fast.
The other side of it is just as real. Brooks also notes that the best reversals “often are very slow to start.” By the time the structure confirms, part of the move is gone. That is the trade-off. Waiting costs some of the move. Guessing early costs a lot of small losses.
The safer use of these signs is to manage the trade you already have, rather than to open one the other way. Shrinking pushes mean you stop adding. A late climax bar is a cue to think about taking some profit. A trendline break means the stop moves up. A new trade in the other direction waits for the structure to turn.
That approach also fits with trend following, where the default is to stay with the trend until it clearly ends.
Where do reversals usually happen?
At levels that matter. Brooks writes that “trend reversals on all time frames always happen at support and resistance levels.” A warning sign at a major resistance level carries more weight than the same sign in the middle of nowhere.
That gives you a simple filter. The 3 warning signs near a prior high, a long-term trendline or a round number deserve attention. The same signs mid-trend, far from any level, are more likely to be a pause.
For the full set of chart-reading skills this builds on, see our guide to price action trading.
So, on the last reversal you called, which stage were you at? Shrinking pushes, a late climax bar or a trendline break? And did the structure ever confirm it?
FAQ
What is the first sign of a trend reversal?
Usually a fade in momentum. The pushes to new highs get smaller, pullbacks get deeper, and candles start to overlap. On its own it is weak evidence, since most tired trends simply pause and continue.
How often do trend reversal patterns work?
Less often than most traders expect. Al Brooks estimates that about 80% of reversal attempts fail, and that even a well-formed major reversal has only a 40% to 50% chance of a profitable swing.
Which indicator is best for spotting trend reversals?
Most indicators are built from past prices, so they tend to confirm a reversal after it starts. The earliest clues come from price itself: shrinking pushes, a late climax bar, and a trendline break.
What is a major trend reversal?
It is a chart with 2 trends and a reversal between them. Brooks says it needs a strong move against the trend that breaks the trendline, then a failed test of the old extreme, then a second leg far enough that most traders agree the trend has changed.
Should beginners trade reversals?
Most beginners do better trading with the trend. Reversal trades fail more often, and they ask you to bet against the market’s main direction. Using reversal signs to protect an existing trade is a gentler way to start.
Go deeper
Reading a reversal well depends on a calm routine more than a clever pattern. The free 15-Minute Swing Trader’s Checklist has the daily routine, the questions to ask before every trade, and the five rules that protect your account. Enter your email and we’ll send it over:
We use your email address to send you the checklist, then emails about trading and our courses. Unsubscribe in one click, any time. Privacy policy.
About the author. Spencer Li is The 15-Minute Trader and the founder of Synapse Trading. He is a Certified Financial Technician (CFTe) with 15+ years of trading, run from 70+ countries. He holds a B.Acc and B.BM from SMU. Every trade he takes is public, dated, losses left in. He teaches low-risk swing trading in 15 minutes a day, one system for any market.
Educational content only, not personalised financial advice. Trading carries risk, including loss of capital. Past performance is not indicative of future results. Synapse Trading is not licensed or regulated by MAS.
Want the daily routine? Enter your email for the free 15-Minute Swing Trader's Checklist.
Free 5-page PDF, then occasional trading emails. Education only, not financial advice. Unsubscribe anytime. Kit stores your email in the US: see our privacy policy.
Want to learn the full method? The Trading Mastery Program teaches the 4 strategies I have traded since 2011. It suits beginners and experienced traders.
Rather follow the trades as they happen? Daily Trading Signals is our Telegram channel: my trade ideas with entry, stop and exit, and every trade is public.
Questions about this post? Ask in the free Telegram channel →
Educational content only, not personalised financial advice. Trading carries risk, including loss of capital. Past performance is not indicative of future results. Synapse Trading is not licensed or regulated by MAS.

