

Average True Range (ATR) Indicator
Want the daily routine? Get the free 15-Minute Swing Trader’s Checklist. Get it free →
What Is the Average True Range (ATR)?
The average true range (ATR) is a technical analysis indicator introduced by market technician J. Welles Wilder Jr. in his book New Concepts in Technical Trading Systems.
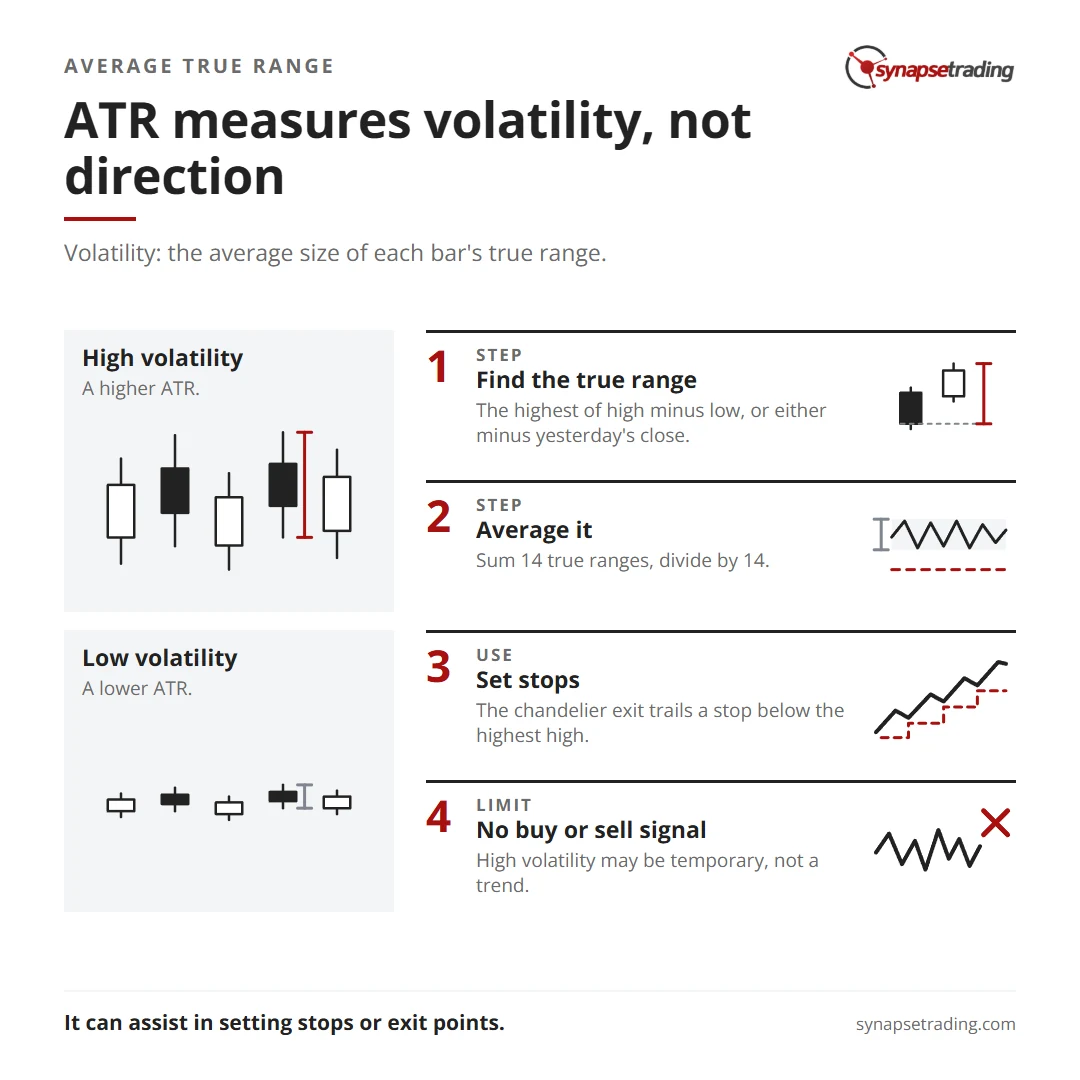
It measures volatility as the average size of each bar’s true range.
The true range indicator is taken as the greatest of the following: current high less the current low, the absolute value of the current high less the previous close, and the absolute value of the current low less the previous close.
The ATR is then a moving average, generally using 14 days, of the true ranges.
The Average True Range (ATR) Formula
The formula to calculate ATR for an investment with a previous ATR calculation is:
Current ATR = [Previous ATR × (n − 1) + TR] ÷ n
Where:
n = Number of periods
TR = True range
If there is not a previous ATR calculated, you must use:
ATR = (TR₁ + TR₂ + … + TRₙ) ÷ n
Where:
TR = Particular true range (first day’s TR, second, third, etc.)
n = Number of periods
To calculate the true range, use the following formula:
TR = Max[(H − L), |H − Cp|, |L − Cp|]
Where:
H = Today’s high
L = Today’s low
C_p = Yesterday’s closing price
Max = Highest value of the three terms
How to Calculate the ATR
To calculate ATR, start by finding the true range values for each day.
The true range for a day is the highest of:
- Today’s high minus the low
- The absolute value of today’s high minus yesterday’s close
- The absolute value of today’s low minus yesterday’s close.
For example, if a stock had a high of $21.95, a low of $20.22, and closed yesterday at $21.51, the true range would be $1.73.
Once you have 14 true range values, sum them and divide by 14 to get the ATR.
If you already have an ATR, use the formula:
Current ATR = [Previous ATR × (n − 1) + TR] ÷ n
This method simplifies the calculation because you only need to calculate the TR for the most recent day.
What Does the ATR Tell You?
The ATR was initially developed for the commodities market but is also used in stocks and indices.
It indicates how much an asset’s price moves on average over a set period.
An asset with high volatility will have a higher ATR, while one with low volatility will have a lower ATR.
ATR is useful for traders to assess market volatility and decide when to enter or exit trades.
ATR does not indicate the direction of price movement but helps measure volatility, which can assist in setting stops or exit points.
A popular use of the ATR is the “chandelier exit,” which uses ATR to set a trailing stop-loss point below the highest high since entering a trade.
Example of How to Use the ATR
Suppose a five-day ATR is calculated at 1.41, and the true range on the sixth day is 1.09.
The next ATR value is calculated by multiplying the previous ATR by the number of days less one, adding the true range, and dividing by the time frame. Here: (1.41 × 4 + 1.09) ÷ 5 = 1.35.
The ATR formula could then be repeated for subsequent periods to track volatility.
While ATR doesn’t indicate the direction of price breakouts, it can be useful for identifying when significant price changes occur.
Limitations of the ATR
ATR gives no buy or sell signal on its own.
It only measures volatility and does not indicate price direction.
Traders may misinterpret high volatility as confirmation of a trend when it may simply reflect temporary fluctuations.
Concluding Thoughts
The average true range (ATR) is a valuable tool for assessing price volatility.
While it does not signal trends, it helps traders evaluate market conditions by providing insight into how much an asset’s price moves.
Its usefulness extends across various markets, including stocks and commodities, providing essential information for determining potential trade entry or exit points based on volatility.
Want the daily routine? Enter your email for the free 15-Minute Swing Trader's Checklist.
Free 5-page PDF, then occasional trading emails. Education only, not financial advice. Unsubscribe anytime. Kit stores your email in the US: see our privacy policy.
Want to learn the full method? The Trading Mastery Program teaches the 4 strategies I have traded since 2011. It suits beginners and experienced traders.
Rather follow the trades as they happen? Daily Trading Signals is our Telegram channel: my trade ideas with entry, stop and exit, and every trade is public.
Questions about this post? Ask in the free Telegram channel →
Educational content only, not personalised financial advice. Trading carries risk, including loss of capital. Past performance is not indicative of future results. Synapse Trading is not licensed or regulated by MAS.

