

Best Forex Trading Indicators
Want the daily routine? Get the free 15-Minute Swing Trader’s Checklist. Get it free →
Forex indicators are vital tools for traders in the forex market. These indicators help traders make informed decisions about when to buy or sell currencies by providing insights into market trends, momentum, and potential reversals. They are a crucial part of technical analysis, and every trader should be familiar with these tools to enhance their trading strategies. Here are the top 10 forex indicators that every trader should know:
1. Moving Average (MA)
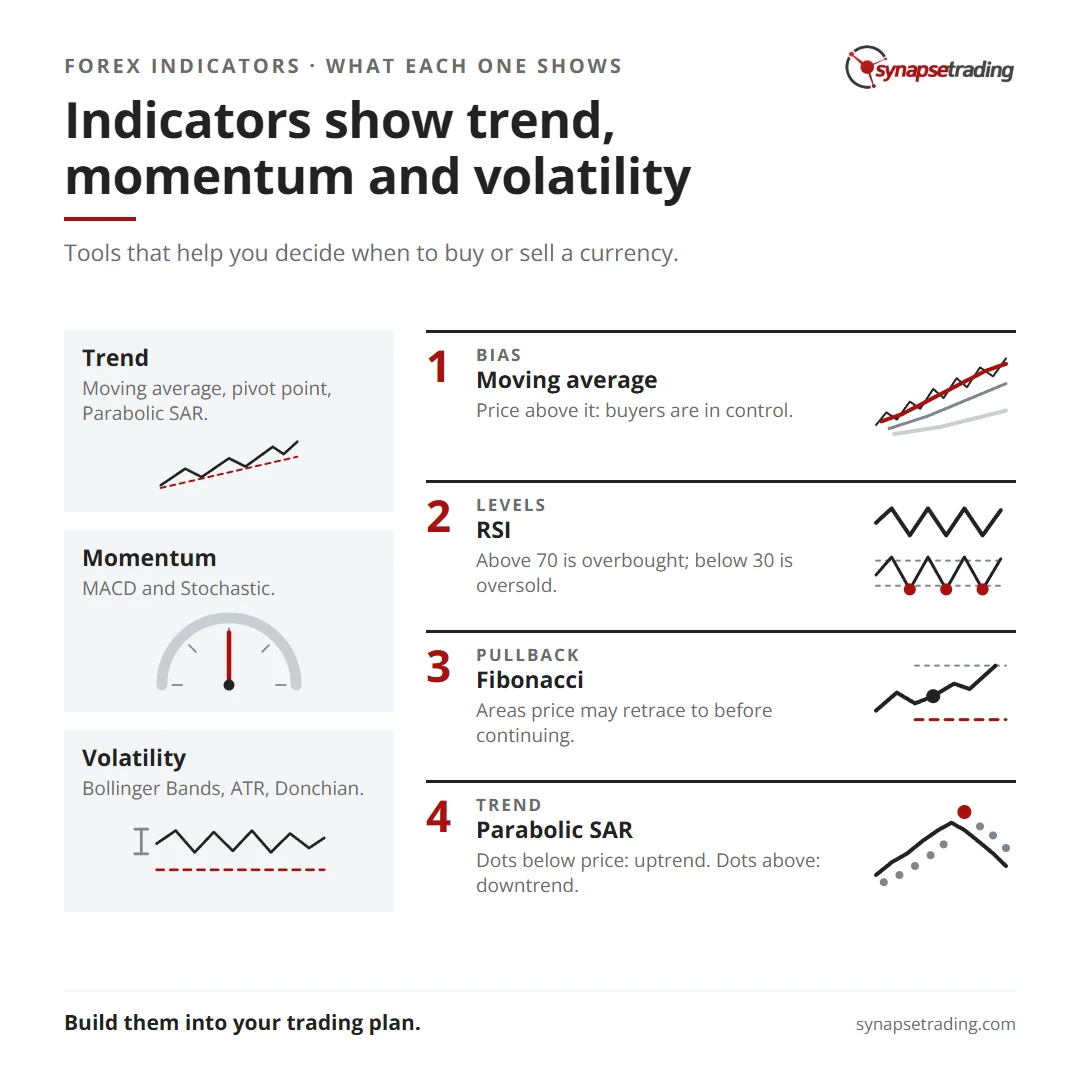
The Moving Average (MA) is a fundamental forex indicator that calculates the average price over a specific period. It helps traders determine the overall direction of the market. If the price is trading above the moving average, it indicates that buyers are in control, while a price below the moving average suggests sellers are dominating. Traders often focus on buying when the price is above the moving average, making it one of the most popular forex indicators.
2. Bollinger Bands
Bollinger Bands are used to measure price volatility and identify potential entry and exit points for trades. This indicator consists of three bands: upper, middle, and lower. The bands help determine overbought and oversold conditions, providing traders with insights into price movements and volatility over time.
3. Average True Range (ATR)
The Average True Range (ATR) measures market volatility by calculating the range between the high and low of a trading period. It helps traders understand the potential price movement of a currency pair. The ATR is particularly useful in determining the level of risk associated with a trade, as higher ATR values indicate greater market volatility.
4. Moving Average Convergence/Divergence (MACD)
The Moving Average Convergence/Divergence (MACD) is a powerful indicator that reveals the momentum of a forex market. It helps traders identify potential trend reversals by comparing short-term and long-term moving averages. The MACD is calculated by subtracting the 26-period EMA (Exponential Moving Average) from the 12-period EMA, providing insights into the strength and direction of a trend.
5. Fibonacci
Fibonacci is a popular forex indicator based on the golden ratio (1.618). Traders use Fibonacci retracement levels to identify potential reversal points in the market. After a significant price movement, Fibonacci levels are plotted to predict areas where the market might retrace before continuing in the original trend direction.
6. Relative Strength Index (RSI)
The Relative Strength Index (RSI) is an oscillator that measures the speed and change of price movements. It helps traders identify overbought and oversold conditions in the market. An RSI value above 70 typically indicates an overbought market, while a value below 30 suggests an oversold market. Traders use the RSI to anticipate potential reversals in the market.
7. Pivot Point
Pivot Points are used to determine the overall trend of the market across different time frames. They indicate the balance levels of supply and demand for currency pairs. If the price reaches the pivot point, it suggests an equilibrium between supply and demand. A price above the pivot point indicates higher demand, while a price below it indicates higher supply.
8. Stochastic
The Stochastic indicator helps traders identify momentum and overbought or oversold conditions. It compares the closing price of a currency pair to its price range over a specific period. Stochastic is particularly useful in recognizing potential trend reversals and is often used in conjunction with other indicators.
9. Donchian Channels
Donchian Channels are used to gauge market volatility by highlighting the highest and lowest price levels over a specific period. The indicator consists of three lines, with the upper and lower bands forming a channel around the median line. Traders use Donchian Channels to identify breakout opportunities and potential price reversals.
10. Parabolic SAR
The Parabolic Stop and Reverse (SAR) indicator helps traders identify the direction of a trend and potential reversal points. It appears as a series of dots on a chart, positioned either above or below the price. If the dots are below the price, it indicates an upward trend; if they are above, it suggests a downward trend. The Parabolic SAR is commonly used to determine entry and exit points in the market.
Concluding Thoughts
Understanding and effectively utilizing these top 10 forex indicators can significantly enhance your trading strategy. These indicators provide crucial insights into market trends, volatility, and potential reversals, helping traders make informed decisions. Whether you’re a beginner or an experienced trader, incorporating these tools into your trading plan can improve your ability to navigate the forex market successfully. You do not need all 10 on one chart, though. For the few worth keeping, and what each one is for, see the best indicators for swing trading.
Want the daily routine? Enter your email for the free 15-Minute Swing Trader's Checklist.
Free 5-page PDF, then occasional trading emails. Education only, not financial advice. Unsubscribe anytime. Kit stores your email in the US: see our privacy policy.
Want to learn the full method? The Trading Mastery Program teaches the 4 strategies I have traded since 2011. It suits beginners and experienced traders.
Rather follow the trades as they happen? Daily Trading Signals is our Telegram channel: my trade ideas with entry, stop and exit, and every trade is public.
Questions about this post? Ask in the free Telegram channel →
Educational content only, not personalised financial advice. Trading carries risk, including loss of capital. Past performance is not indicative of future results. Synapse Trading is not licensed or regulated by MAS.

