

Price Rate Of Change (ROC) Indicator
Want the daily routine? Get the free 15-Minute Swing Trader’s Checklist. Get it free →
The Price Rate of Change (ROC) is a momentum-based technical indicator that measures the percentage change in an asset’s price between the current price and the price from a specified number of periods ago.
This indicator helps traders identify the strength of a price trend and potential reversal points by plotting the ROC against a zero line.
Key Features of the Price ROC Indicator
- Momentum Indicator: The ROC shows the velocity of price movements by comparing the current price to the price “n” periods ago.
- Zero Line: The ROC oscillates around a zero line, where positive values indicate upward momentum, and negative values indicate downward momentum.
- Versatility: The ROC is used to spot divergences, overbought and oversold conditions, and centerline crossovers, which can signal potential trend changes.
Formula for the Price ROC Indicator
Price ROC=(Current Price−Price n periods agoPrice n periods ago)×100\text{Price ROC} = \left(\frac{\text{Current Price} – \text{Price } n \text{ periods ago}}{\text{Price } n \text{ periods ago}}\right) \times 100
How to Calculate the Price ROC
- Select the “n” Value: Determine the number of periods to compare, such as 9 for short-term analysis or 200 for long-term analysis.
- Find Recent Closing Prices: Identify the current closing price and the closing price from “n” periods ago.
- Apply the Formula: Plug the prices into the ROC formula to calculate the indicator value.
- Monitor and Update: As new periods close, recalculate the ROC to reflect current price momentum.
Interpretation of the Price ROC Indicator
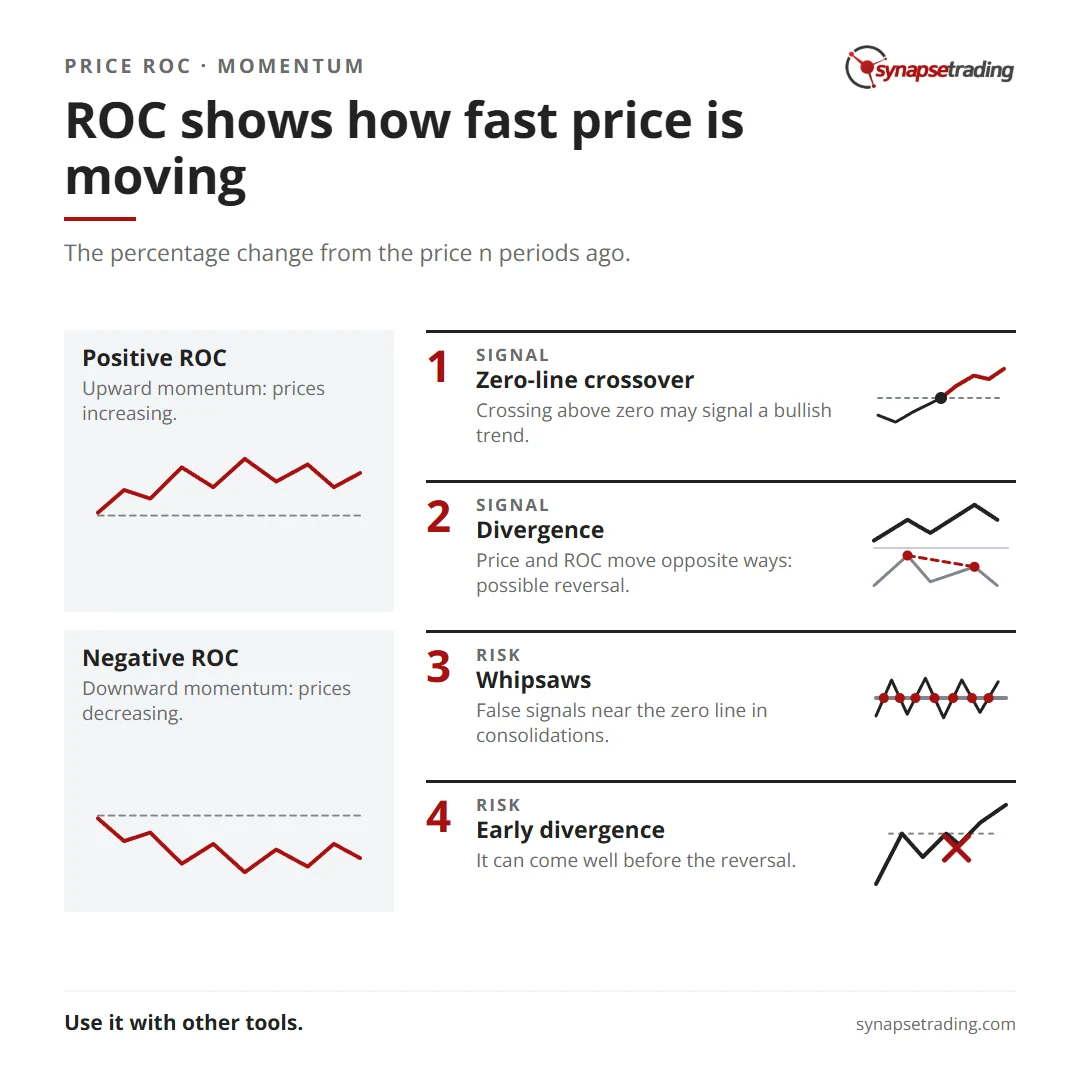
- Positive ROC: Indicates upward momentum, suggesting that prices are increasing compared to the past.
- Negative ROC: Indicates downward momentum, suggesting that prices are decreasing compared to the past.
- Zero-Line Crossover: When the ROC crosses above zero, it may signal a bullish trend, and crossing below zero may indicate a bearish trend.
Applications
- Divergence: ROC divergence occurs when the price moves in one direction while the ROC moves in the opposite direction, signaling a potential trend reversal.
- Overbought/Oversold Conditions: Traders monitor extreme ROC values to identify potential overbought or oversold conditions, often leading to price reversals.
Price ROC vs. Momentum Indicator
- ROC: Divides the price difference by the price “n” periods ago to express the change as a percentage.
- Momentum Indicator: Often multiplies the price difference by 100 or compares the current price to the price “n” periods ago without converting the result into a percentage. Both indicators convey similar information, though the ROC’s percentage format offers a slightly different perspective.
Limitations of the Price ROC Indicator
- Whipsaws: The ROC can produce false signals, particularly around the zero line, during periods of price consolidation.
- Early Divergence Signals: ROC divergence can occur well before an actual trend reversal, making it less reliable as a standalone trade signal.
- Equal Weighting: The ROC gives equal importance to recent and past prices, which might not always reflect the most accurate picture of current market conditions.
Concluding Thoughts
The Price ROC indicator is a versatile tool for measuring price momentum and identifying potential trend reversals. However, its tendency to produce false signals during consolidations and early divergence warnings means it should be used in conjunction with other technical analysis tools for more reliable trading decisions. By understanding its mechanics and limitations, traders can better utilize the ROC to enhance their market analysis.
Want the daily routine? Enter your email for the free 15-Minute Swing Trader's Checklist.
Free 5-page PDF, then occasional trading emails. Education only, not financial advice. Unsubscribe anytime. Kit stores your email in the US: see our privacy policy.
Want to learn the full method? The Trading Mastery Program teaches the 4 strategies I have traded since 2011. It suits beginners and experienced traders.
Rather follow the trades as they happen? Daily Trading Signals is our Telegram channel: my trade ideas with entry, stop and exit, and every trade is public.
Questions about this post? Ask in the free Telegram channel →
Educational content only, not personalised financial advice. Trading carries risk, including loss of capital. Past performance is not indicative of future results. Synapse Trading is not licensed or regulated by MAS.

