

Average Directional Index (ADX) Indicator
Want the daily routine? Get the free 15-Minute Swing Trader’s Checklist. Get it free →
The Average Directional Index (ADX) is a technical analysis indicator used by traders to gauge the strength of a trend, regardless of its direction.
The ADX is often accompanied by two other indicators, the Negative Directional Indicator (-DI) and the Positive Directional Indicator (+DI), which together help traders determine whether to go long, short, or avoid trading altogether.
Understanding the ADX Calculation
Calculating the ADX involves a series of steps due to the presence of multiple lines in the indicator. The steps are as follows:
- Calculate +DM, -DM, and True Range (TR) for each period:
- +DM = Current High – Previous High
- -DM = Previous Low – Current Low
- TR is the greater of the current high minus the current low, current high minus the previous close, or current low minus the previous close.
- Smooth the 14-period averages of +DM, -DM, and TR:
- The smoothing process involves summing up the first 14 TR readings and then updating them with new TR values while dropping the oldest.
- Calculate +DI and -DI:
- +DI = (Smoothed +DM / Smoothed TR) * 100
- -DI = (Smoothed -DM / Smoothed TR) * 100
- Determine the Directional Movement Index (DMI):
- DMI = (| +DI – -DI | / | +DI + -DI |) * 100
- Calculate the ADX:
- The ADX is calculated by smoothing the DX values over a set number of periods, typically 14.
Interpreting the ADX
The ADX, along with the +DI and -DI, provides traders with essential information about the trend strength and direction:
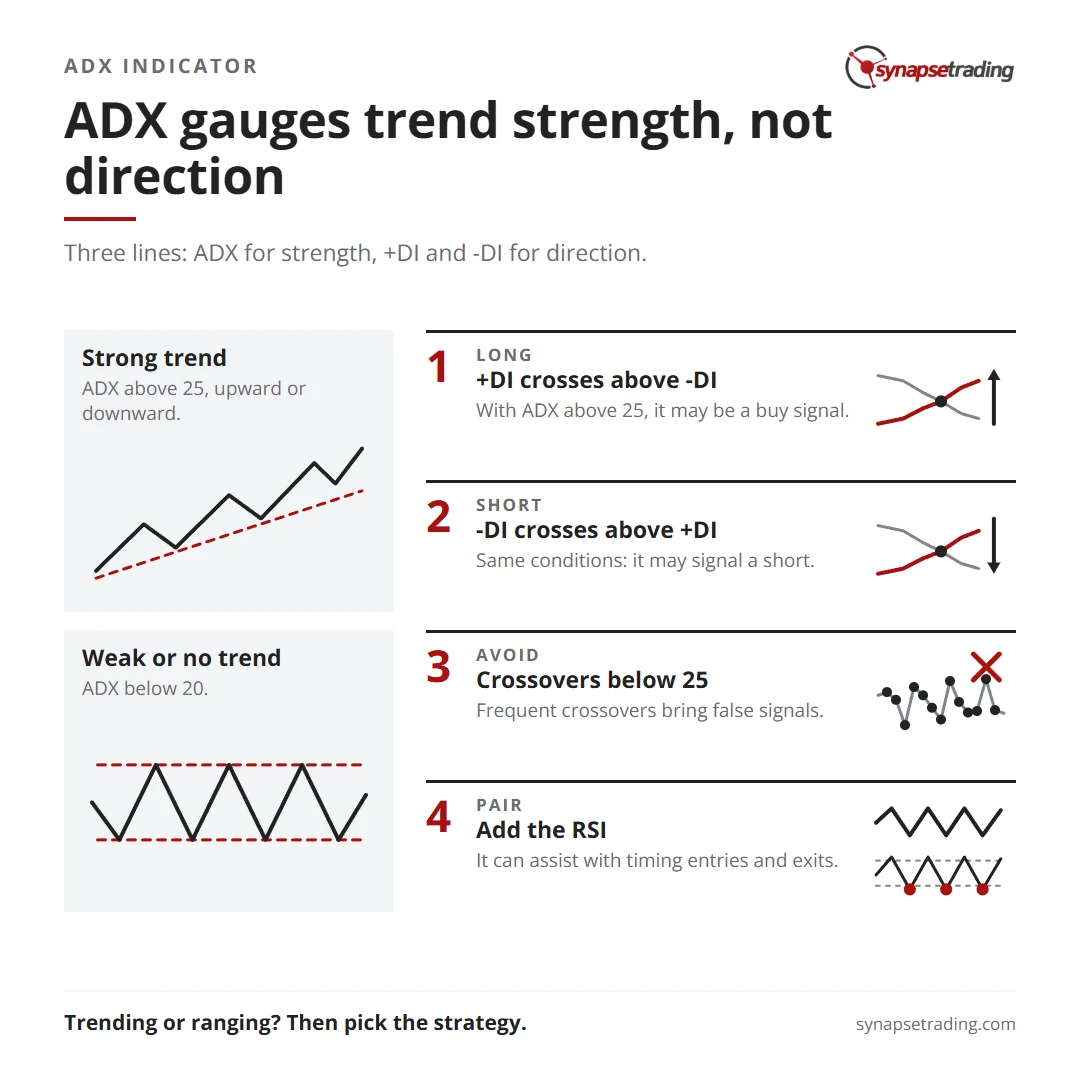
- Strong Trend: An ADX above 25 indicates a strong trend, which could be either upward or downward.
- Weak or Non-Trending Market: An ADX below 20 suggests a weak trend or a market that is trendless.
- Trade Signals: Crossovers between the +DI and -DI lines can signal potential trading opportunities. For example, if +DI crosses above -DI and the ADX is above 25, it may be a buy signal. Conversely, if -DI crosses above +DI under the same conditions, it may signal a short trade.
ADX vs. The Aroon Indicator
While the ADX indicator includes three lines (+DI, -DI, and ADX), the Aroon indicator consists of only two.
Both indicators aim to identify trend direction and strength, but they use different calculations, which may result in different crossover signals.
Limitations of the ADX
The ADX can produce frequent crossovers, leading to potential confusion or losses if trades are entered based on false signals.
These are particularly common when the ADX is below 25.
To mitigate these issues, the ADX is best used alongside other technical indicators and price analysis.
FAQs
- What is a good ADX value? An ADX above 25 is generally considered strong, indicating a significant trend. Below 20, the trend is weak or non-existent.
- Is the ADX a good indicator? Yes, particularly when combined with price action analysis and other indicators, the ADX can effectively measure trend strength and direction.
- What indicators work well with the ADX? The Relative Strength Index (RSI) is often used with the ADX. While the ADX measures trend strength, the RSI can assist with timing entries and exits.
Concluding Thoughts
The Average Directional Index (ADX) is a valuable tool for technical traders seeking to assess the strength and direction of trends.
When used correctly, it can help traders determine whether a market is trending or ranging and guide them in selecting the appropriate trading strategy.
Although the ADX is effective on its own, combining it with other technical indicators like the RSI or moving averages can further enhance its usefulness in a trading strategy.
Want the daily routine? Enter your email for the free 15-Minute Swing Trader's Checklist.
Free 5-page PDF, then occasional trading emails. Education only, not financial advice. Unsubscribe anytime. Kit stores your email in the US: see our privacy policy.
Want to learn the full method? The Trading Mastery Program teaches the 4 strategies I have traded since 2011. It suits beginners and experienced traders.
Rather follow the trades as they happen? Daily Trading Signals is our Telegram channel: my trade ideas with entry, stop and exit, and every trade is public.
Questions about this post? Ask in the free Telegram channel →
Educational content only, not personalised financial advice. Trading carries risk, including loss of capital. Past performance is not indicative of future results. Synapse Trading is not licensed or regulated by MAS.

