• Link to Facebook
  • Link to X
  • Link to Instagram
  • Link to Youtube
  • Link to LinkedIn
  • Link to Mail
Free PDF: The 15-Minute Swing Trader's Checklist, the daily routine of a trader since 2007
Synapse Trading
  • Mentoring
    • Trading Mastery Program
    • All mentoring options
  • Signals
    • Daily trading signals
    • Signals trade log
  • Results
    • Student results and testimonials
    • Public trade log, losses left in
  • Free guides
    • Start here
    • Trading foundations
    • Technical analysis
    • Strategies and systems
    • Risk and money
    • Trading psychology
    • Markets and products
    • Free trading guides
    • Tools and resources
    • Blog
  • About
    • My background
    • My trading journey
    • Media and interviews
    • Travel log
  • Contact
    • Contact me
    • Partnerships
  • Start free
  • Click to open the search input field Click to open the search input field Search
  • Menu Menu
The Synapse Network

What are Trend Indicators or Trend Following Indicators?

Technical Analysis & Price Action
How trend indicators work - indicators

Want the daily routine? Get the free 15-Minute Swing Trader’s Checklist. Get it free →

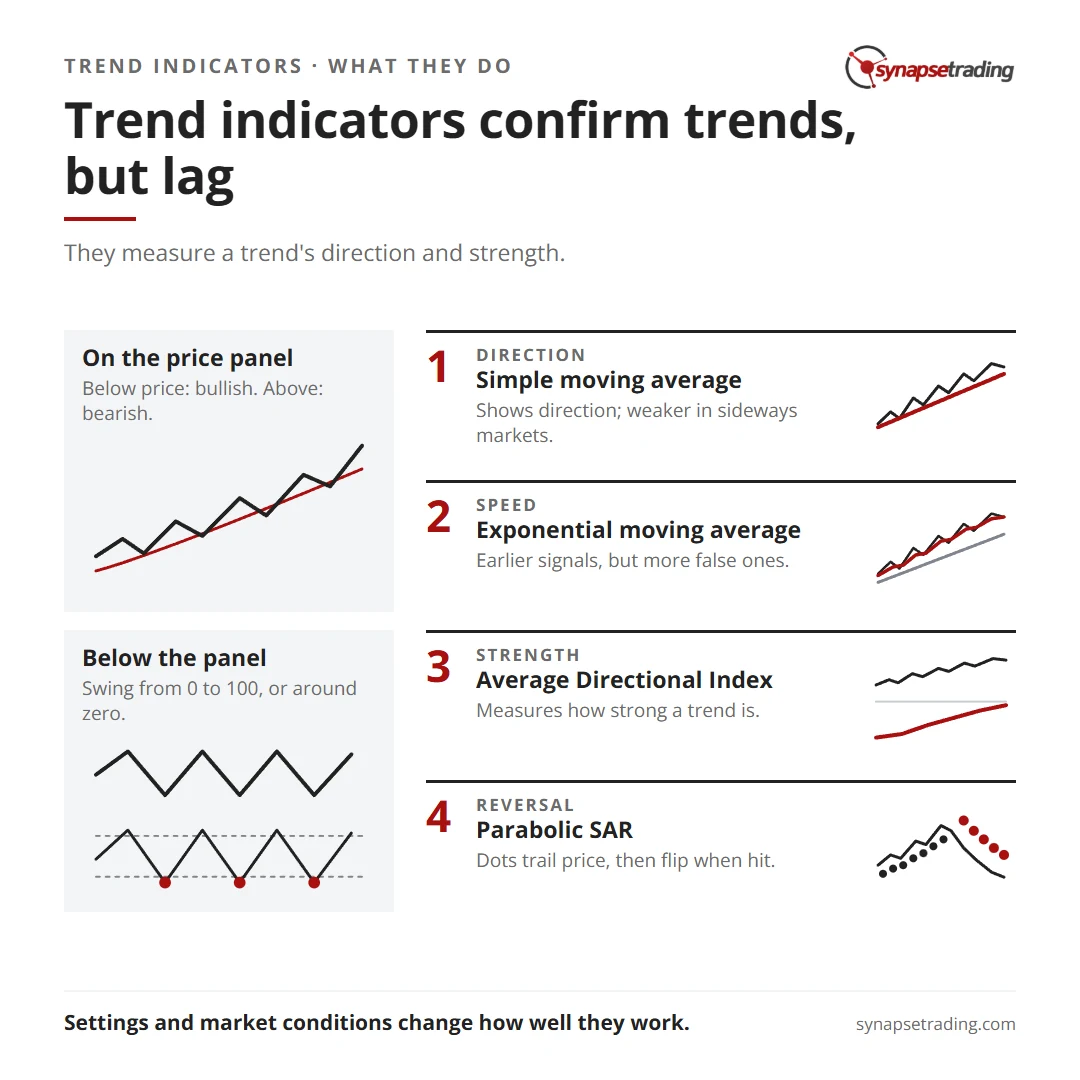
Trend-following indicators are technical tools that measure the direction and strength of trends within a chosen time frame.

Some trend-following indicators are plotted directly on the price panel.

These indicators issue a bearish signal when positioned above the price and a bullish signal when situated below the price.

Others are drawn below the panel, generating upticks and downticks from 0 to 100 or across a central ‘zero’ line.

These indicators create bullish or bearish divergences when their signals oppose the price action.
Trend indicators confirm trends, but lag. Summary card for the post: What are Trend Indicators or Trend Following Indicators?.

Table of Contents

Toggle
  • Characteristics of Trend-Following Indicators
  • Functions of Trend-Following Indicators
  • Types of Trend-Following Indicators
    • Simple Moving Average (SMA)
    • Exponential Moving Average (EMA)
    • Average Directional Index (ADX/DMS)
    • Moving Average Convergence-Divergence (MACD)
    • Parabolic Stop and Reverse (Parabolic SAR)
  • Additional Trend-Following Indicators
  • Concluding Thoughts

Characteristics of Trend-Following Indicators

Most trend-following indicators are ‘lagging,’ meaning they generate a buy or sell signal after a trend or reversal is already underway.

The moving average is the most popular lagging trend-following indicator.

Functions of Trend-Following Indicators

Trend-following indicators serve three primary functions:

  1. Alerting the Technician: They alert the technician to a developing trend or an impending reversal.
  2. Predicting Price Direction: They predict short- and long-term price direction.
  3. Confirming Observations: They confirm observations and signals in the price pattern and other technical indicators.

Signal reliability is dependent on the settings used for drawing the trend-following indicator.

For example, a 50-day moving average and a 200-day moving average generate unique buy and sell signals that may work in one time frame but not in another.

Types of Trend-Following Indicators

Simple Moving Average (SMA)

The Simple Moving Average (SMA) measures the average price across a range of price bars chosen by the technician.

It shows the direction of the current trend.

The SMA is less effective in sideways and range-bound markets.

Interactions between the price and the moving average generate bullish and bearish divergences, which evaluate trend strength and direction.

Exponential Moving Average (EMA)

The Exponential Moving Average (EMA) measures the average price across a range of price bars but places greater weight on more recent data points.

This weighting makes it respond more quickly to recent price action than the SMA, theoretically generating earlier buy and sell signals.

However, this weighting also tends to generate more false signals than the SMA.

Average Directional Index (ADX/DMS)

The Average Directional Index (ADX/DMS) measures the strength or weakness of an active trend.

It smooths directional movement over one look-back period to generate three lines—ADX, +DMI, and -DMI.

These lines cross higher or lower through a panel with values between 0 and 100.

ADX measures the strength of an uptrend when +DMI is above -DMI and the strength of a downtrend when +DMI is below -DMI.

Moving Average Convergence-Divergence (MACD)

Moving Average Convergence-Divergence (MACD) is a widely used technical tool that analyzes the relationship between moving averages set at different intervals.

MACD generates directional lines or a histogram that gauges current momentum and price direction.

It is calculated by subtracting a 26-period EMA from a 12-period EMA, with a 9-period EMA of the MACD, called the ‘signal line,’ added to the plot.

Parabolic Stop and Reverse (Parabolic SAR)

Developed by RSI creator Welles Wilder Jr., the Parabolic Stop and Reverse (Parabolic SAR) is used to confirm trend direction and generate reversal signals.

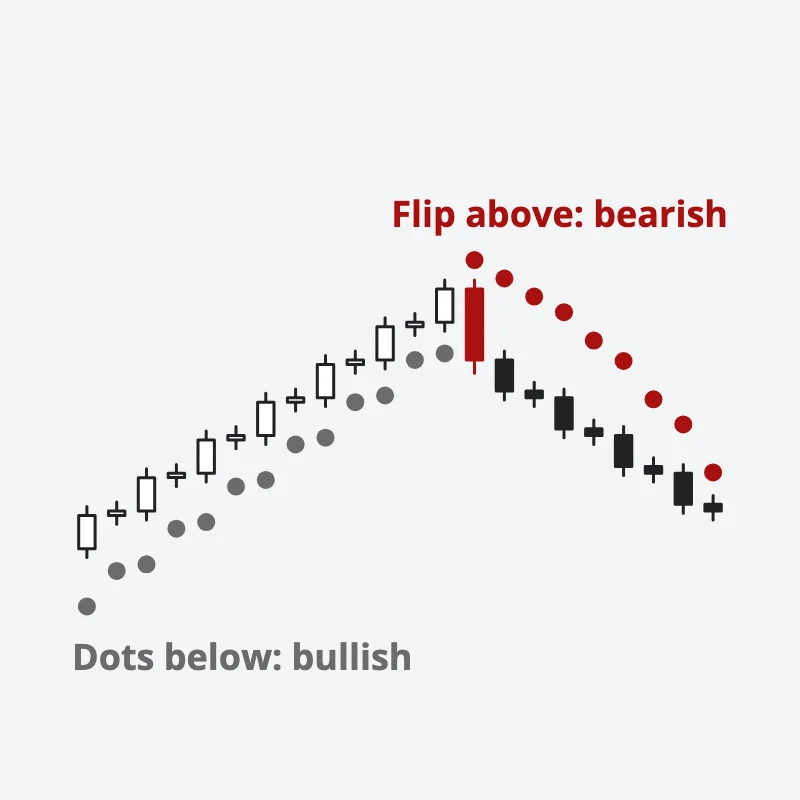
Indicator data points generate dots above or below the price on the main chart panel.

The calculation applies an ‘invisible’ trailing stop, forcing the indicator to change direction when hit, marking a potential trend reversal.

Candles rise with Parabolic SAR dots trailing below them, then price falls into the dots and they flip above in red, marking a reversal
Parabolic SAR dots trail below price in an uptrend and flip above when price hits them.

Additional Trend-Following Indicators

  • Accumulative Swing Index: Evaluates the long-term trend through changes in opening, closing, high, and low prices.
  • Alligator: Uses three Fibonacci-tuned moving averages to identify trends and reversals.
  • Aroon: Evaluates whether a security is trending or range-bound and, if trending, the strength or weakness of the advance or decline.
  • Elder Ray Index: Evaluates buying and selling pressure by separating price action into bull and bear power.
  • ZigZag: Connects plot points on a price chart that reverse whenever the asset reverses by more than a specified percentage.

Concluding Thoughts

Trend-following indicators are essential tools for traders and investors aiming to capitalize on market trends.

While they offer valuable insights into the direction and strength of trends, their effectiveness can vary based on the settings and market conditions.

Using these indicators in conjunction with other technical analysis tools can enhance their reliability and help traders make more informed decisions.


Want the daily routine? Enter your email for the free 15-Minute Swing Trader's Checklist.

Free 5-page PDF, then occasional trading emails. Education only, not financial advice. Unsubscribe anytime. Kit stores your email in the US: see our privacy policy.

Want to learn the full method? The Trading Mastery Program teaches the 4 strategies I have traded since 2011. It suits beginners and experienced traders.

Rather follow the trades as they happen? Daily Trading Signals is our Telegram channel: my trade ideas with entry, stop and exit, and every trade is public.

Questions about this post? Ask in the free Telegram channel →

Educational content only, not personalised financial advice. Trading carries risk, including loss of capital. Past performance is not indicative of future results. Synapse Trading is not licensed or regulated by MAS.

by The Synapse Network
Share this entry
  • Share on Facebook
  • Share on X
  • Share on WhatsApp
  • Share on Pinterest
  • Share on LinkedIn
  • Share on Tumblr
  • Share on Vk
  • Share on Reddit
  • Share by Mail
  • Visit us on Yelp
  • Link to Instagram
  • Link to Youtube
https://synapsetrading.com/wp-content/uploads/2026/10/what-are-trend-indicators-or-trend-following-indicators-card.webp 630 1200 The Synapse Network https://synapsetrading.com/wp-content/uploads/2026/10/synapse-logo-horizontal-light.png The Synapse Network2023-09-03 15:49:592026-06-17 21:31:45What are Trend Indicators or Trend Following Indicators?

Free checklist

The 15-Minute Swing Trader’s Checklist

The daily and weekly routine I use to find, manage and review trades in about 15 minutes a day, trading since 2007.

Get the free checklist

Topics

  • Trading foundations
  • Technical analysis
  • Strategies and systems
  • Risk and money
  • Trading psychology
  • Markets and products

Synapse Trading

Swing trading for busy professionals, in 15 minutes a day.

Start free

Learn

  • Start here
  • Free trading guides
  • Blog
  • Tools and resources

Programs

  • Trading Mastery Program
  • Daily trading signals
  • Student results
  • Public trade log

Company

  • About
  • Contact me
  • Partnerships
  • Disclaimer
  • Privacy policy
  • Terms & Conditions

Synapse Trading Pte Ltd
Registration No. 201316168H
WhatsApp +65-8897-1204
info@synapsetrading.com

Contact Us

Synapse Trading Pte Ltd
Registration No. 201316168H

Whatsapp: +65-8897-1204
Telegram: @iamrecneps
Email: info@synapsetrading.com

Links

Disclaimer
Privacy policy
Terms & Conditions
Contact us
Partnerships

© 2012-2026 Synapse Trading | All rights reserved. Educational content only, not personalised financial advice. Trading carries risk, including loss of capital. Past performance is not indicative of future results. Synapse Trading is not licensed or regulated by MAS.
  • Link to Facebook
  • Link to X
  • Link to Instagram
  • Link to Youtube
  • Link to LinkedIn
  • Link to Mail
Link to: What are the Different Types of Technical Trading Indicators? Link to: What are the Different Types of Technical Trading Indicators? What are the Different Types of Technical Trading Indicators?
Types of trading indicators - indicators
Link to: Moving Average Indicator Link to: Moving Average Indicator
The moving average - indicators
Moving Average Indicator
Scroll to top Scroll to top Scroll to top