

Best Forex Candlestick Patterns
Want the daily routine? Get the free 15-Minute Swing Trader’s Checklist. Get it free →
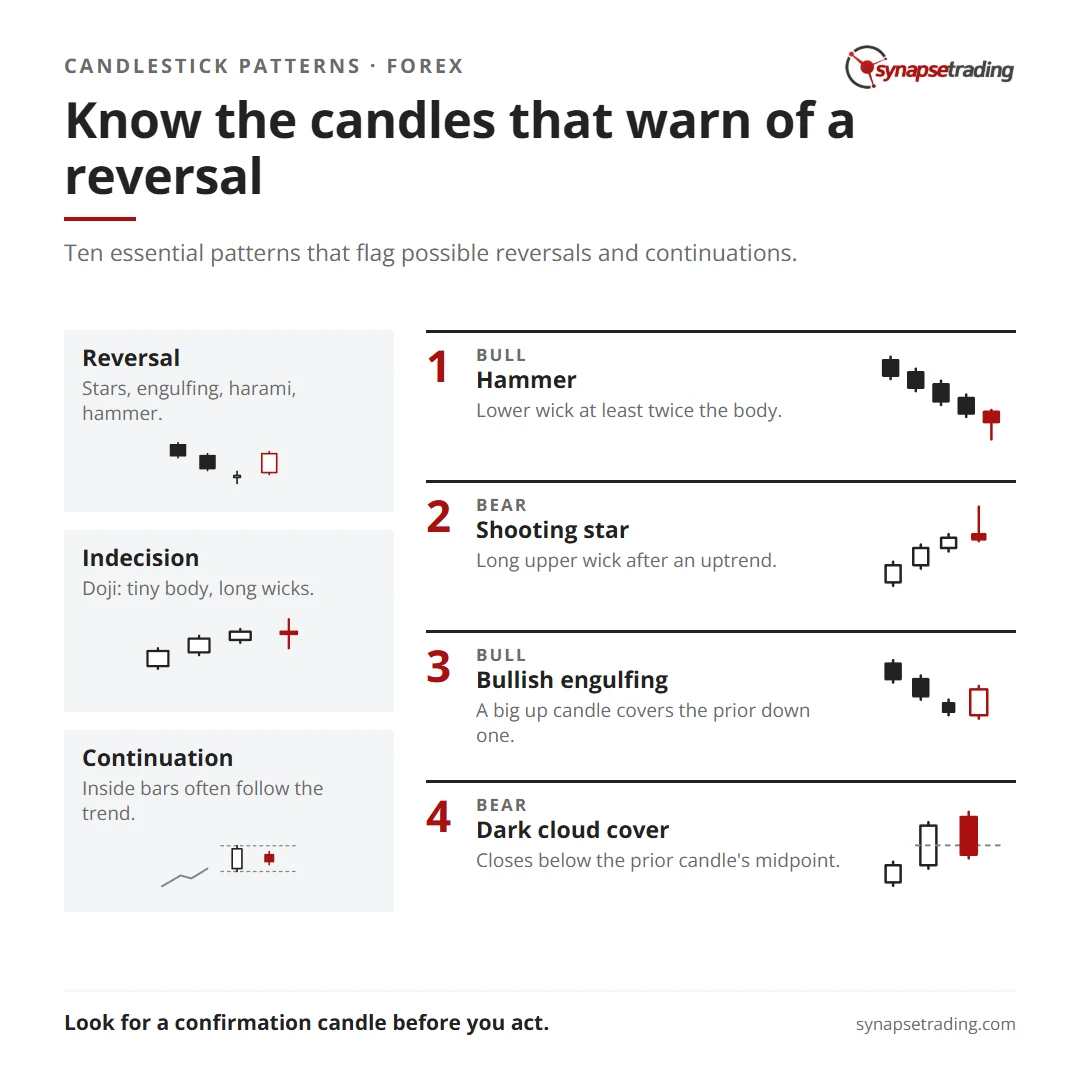
The following are ten essential candlestick patterns that traders should be familiar with to effectively navigate the markets:
1. Evening Star and Morning Star
The evening and morning star candlestick patterns are reversal indicators that occur at the end of upward and downward trends, respectively. Named after their star-shaped formation, these patterns typically signal a change in market direction. The evening star pattern starts with a candlestick in the direction of the trend, followed by a small-bodied candle, and concludes with a candlestick moving in the direction of the reversal. The morning star pattern follows the same structure but in the opposite direction. To trade these patterns, traders look for a confirmation candle that supports the reversal, such as a bearish candle after an evening star.
2. Bullish & Bearish Engulfing
Bullish and bearish engulfing patterns are powerful reversal signals. A bullish engulfing pattern shows that buyers (bulls) have overtaken sellers (bears), with the green (bullish) candle completely engulfing the previous red (bearish) candle. Conversely, a bearish engulfing pattern consists of a small green candle followed by a larger red candle that completely engulfs the first, indicating a potential shift from an upward to a downward trend.
3. Doji
The Doji candlestick pattern signifies market indecision and often indicates a potential reversal or consolidation. This pattern can appear at the top of an uptrend, the bottom of a downtrend, or within a trend. The Doji has a very small body, with long upper and lower wicks, reflecting a balance between buying and selling pressures.
4. Hammer
The Hammer is a bullish reversal pattern that usually appears at the bottom of a downtrend. Characterized by a small body with a long lower wick (at least twice the length of the body), the Hammer suggests that sellers drove prices down during the session, but strong buying pressure pushed prices back up, potentially reversing the downtrend. The body can be either bullish or bearish, though a bullish body is generally more favorable.
5. Bullish & Bearish Harami
The Bullish and Bearish Harami patterns are reversal indicators. The term “Harami” means “pregnant” in Japanese, as the pattern resembles a pregnant woman. In a bullish Harami, the first candle is bearish, followed by a smaller bullish candle that is contained within the body of the first. The opposite is true for a bearish Harami, where an uptrend is followed by a small bearish candle within the body of the first.
6. Dark Cloud Cover
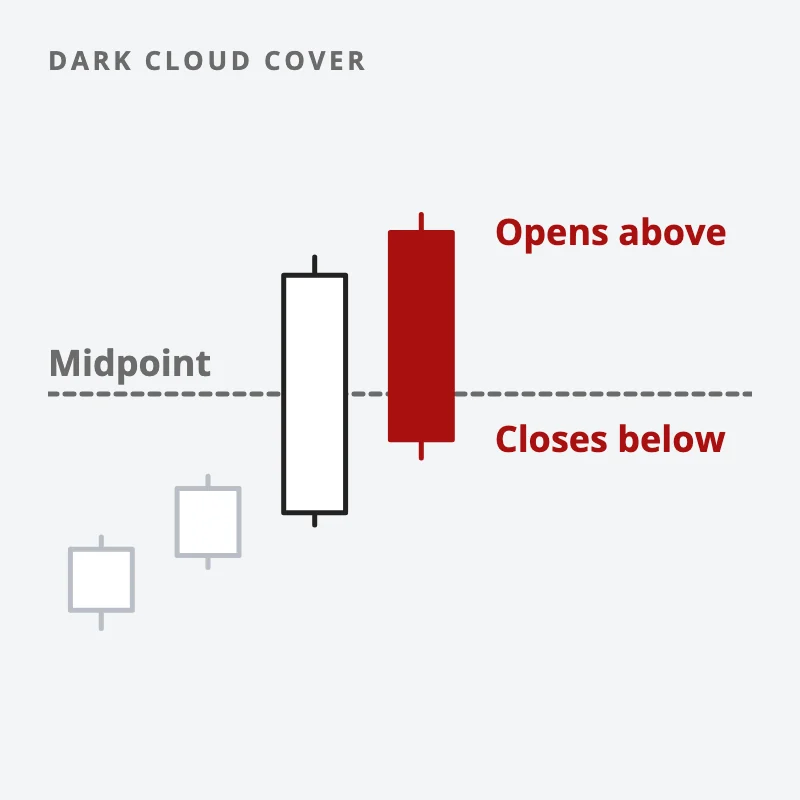
The Dark Cloud Cover is a bearish reversal pattern that occurs during an uptrend. It begins with a bullish candle, followed by a bearish candle that opens above the previous day’s close but closes below the midpoint of the bullish candle. This pattern is similar to the Bearish Engulfing pattern, with the key difference being the position of the second candle’s open and close relative to the first candle.
7. Piercing Pattern
The Piercing Pattern is a bullish reversal signal that typically appears at the end of a downtrend or during a pullback within an uptrend. It consists of a bearish candle followed by a bullish candle that closes above the midpoint of the bearish candle. This pattern suggests that buyers are stepping in to drive prices higher, potentially reversing the downtrend.
8. Inside Bars
Inside Bar patterns occur in trending markets and signal potential continuation or reversal. The Inside Bar is formed when the high and low of the bar are within the range of the previous candle, known as the “mother bar.” Traders often use Inside Bars to continue trading in the direction of the trend, but they can also indicate a reversal if they occur at key support or resistance levels.
9. Long Wicks
Long Wicks on candlesticks often indicate a potential reversal in the market trend. These patterns occur when prices test certain levels and are rejected, leaving a long wick on the candle. The direction and length of the wick provide insight into the strength of the rejection and the possible future direction of the market. Identifying the trend and key levels is crucial when interpreting Long Wick patterns.
10. Shooting Star
The Shooting Star is a bearish reversal pattern that appears after an uptrend. It has a small body near the day’s low, a long upper wick, and little to no lower wick. The long upper wick indicates that the market tested higher prices but faced strong selling pressure, pushing the price back down. This pattern suggests that the uptrend may be losing momentum and a downward reversal could follow.
These candlestick patterns are essential tools for traders, helping them identify potential market reversals and continuation signals. Understanding and recognizing these patterns can significantly enhance trading strategies and decision-making processes.
Want the daily routine? Enter your email for the free 15-Minute Swing Trader's Checklist.
Free 5-page PDF, then occasional trading emails. Education only, not financial advice. Unsubscribe anytime. Kit stores your email in the US: see our privacy policy.
Want to learn the full method? The Trading Mastery Program teaches the 4 strategies I have traded since 2011. It suits beginners and experienced traders.
Rather follow the trades as they happen? Daily Trading Signals is our Telegram channel: my trade ideas with entry, stop and exit, and every trade is public.
Questions about this post? Ask in the free Telegram channel →
Educational content only, not personalised financial advice. Trading carries risk, including loss of capital. Past performance is not indicative of future results. Synapse Trading is not licensed or regulated by MAS.

