
A New Data-Driven Way to Tackle the Stock Market
A cutting edge revolutionary algorithm leveraging on AI (artificial intelligence) & Fintech (financial technology)
- Find top 3-5 trading opportunities daily
- Build an optimised investment portfolio
- Choose any 5 stock markets worldwide
- Get 10 years of historical data
- Spend 15 minutes a day trading

Photo: Live demonstration at the Singapore Stock Exchange (SGX)
This revolutionary stock analysis tool can sieve through over 10,000 stocks worldwide, analysing and ranking every stock, and presenting the results in a visually-convenient summary table. This allows traders to pick out profitable trades with less than 15 minutes a day, and helps investors build and optimise their portfolio efficiently. This software subscription also comes with free access to 10 years of historical data for 5 primary markets.
How Does the Software Work?
“Synapse Stock Screener” Guide – Part 1 (Introduction)
This guide will teach you how to:
– Select your chosen stock markets
– Download stock data and do price adjustments
– Create cusotmised watchlists
– Add/remove indicators
– Save your workspaces/charts
– Access our customised screener and chart layout
Video edit: I have managed to fix the workspace error, so it should work on your software.
“Synapse Stock Screener” Guide – Part 2 (Screener Table of Results)
This guide will teach you how to:
– Configure the optimal price/volume before screening
– Interpret all the columns in the screener results table
– First cluster: SCORE, Break, Swing
– Second cluster: xVol, Close, %C
– Third cluster: EP, SL, Flux (-), Flux (+)
– Fourth cluster: Beta, Alpha, Trend
– Sort and filter results to perform analysis
“Synapse Stock Screener” Guide – Part 3 (Customised Chart Layout)
This guide will teach you how to:
– Access and interpret the customised chart layouts
– Toggle the 3 different layouts on and off
– Use the auto-coloured price bar analysis
– Use the coloured trend ribbon
– Read the “Synapse Accumulation/Distribution Score”
– Use the auto-stoploss feature
– Generate the buy/sell signal arrows
“Synapse Stock Screener” Guide – Part 4 (Investing Strategies)
This guide will teach you how to:
– Idenitify major market reversals to buy stocks just a bull trend is starting and get out just before the market crashes
– Get an overview of all the asset classes and sectors to diversify your portfolio in line with the market cycles
– Optimize your portfolio with Alpha & Beta to reduce systematic risk
“Synapse Stock Screener” Guide – Part 5 (Trading Strategies)
This guide will teach you how to:
– Flag out abnormal price/volume movements (high/climatic volume)
– Identify strong trending stocks and the best time to ride on them
– Spot high-probability breakouts to enter trades just before a big move
– Use the “SCORE” feature to find the top 3-5 best trades on a daily basis
Here are some deeper insights into the software functions
- Market Breadth: Get an instant snapshot of the overall market strength/weakness
- Trade Setups: Automatically scan for the best trading opportunities across all markets
- Behavioral Analysis: Flag out abnormal price/volume behavior to detect big money
- Risk Management: Plan your trade parameters (entry price, stoploss, profit target)
- Optimise Returns: Use advanced statistics to calculate Flux and increase probability
- Trend-following: Perfect for long-term investors to spot turning points and catch big moves
- Portfolio Construction: Diversify away hidden risks with Alpha & Beta
1) Market Breadth
Get an instant snapshot of overall market strength/weakness
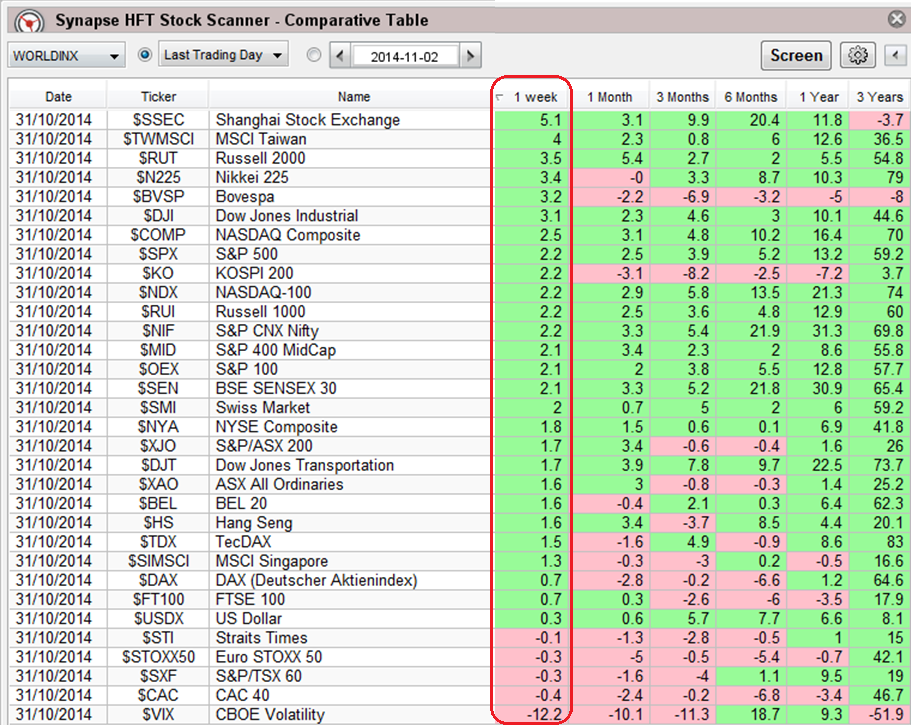
This allows you to compare the performance (% change) of:
- Counters over a period of 1 week, 1 month, 3 months, 6 months, 1 year, or 3 years
- Global indices & ETFs (as shown in the example above)
- Stocks within your own portfolio or customised watchlist
- Stocks within the same sector (eg. real estate, O&M, commodities, etc)
- Component stocks of an index (eg. 30 stocks in the STI index)
Besides giving you an instant overview of the market by letting you know which indices, sectors and stocks are doing well, it also gives you insight into the breadth of the market, for example by looking at the number of green vs. pink cells, you can immediately see whether the bulk of counters are strong or weak. This will tell you how strong the trend of the general broad market is.
Lastly, if you have a watchlist of fundamentally strong stocks you are looking to buy cheap, ranking those stocks by their 1 or 3 year performance allows you to instantly tell which counters have corrected significantly, thus ensuring you won’t miss out any valuable buying opportunities.
2) Trade Setups
Scan for best trading opportunities across all markets



“RANK” assigns a score to every trade setup, thus allowing you to sieve out the low probability trades, and focus on only the best of the best trades. The higher the score, the better the trade, and ideally we aim for trades that have a score above 50.
“Break” helps traders identify stocks that are making new highs or lows (20-day, 50-day, 100-day, 200-day, 300-day high/low), thus allowing traders to buy on strength and sell on weakness. This is for traders who are willing to take higher risk to catch bigger moves in the market over a medium to long-term timeframe.
“Swing” helps traders to identify strong trending stocks that are having a retracement (small correction), thus providing a low-risk and high-probability entry opportunity. This is for traders who are looking to catch powerful swings in the market over a short to medium-term timeframe.
The best daily opportunities are highlighted in dark green (buy) & dark red (short) under both the “Break” and “Swing” column.
3) Behavioral Analysis
Flag out abnormal price/volume behavior to detect big money movement
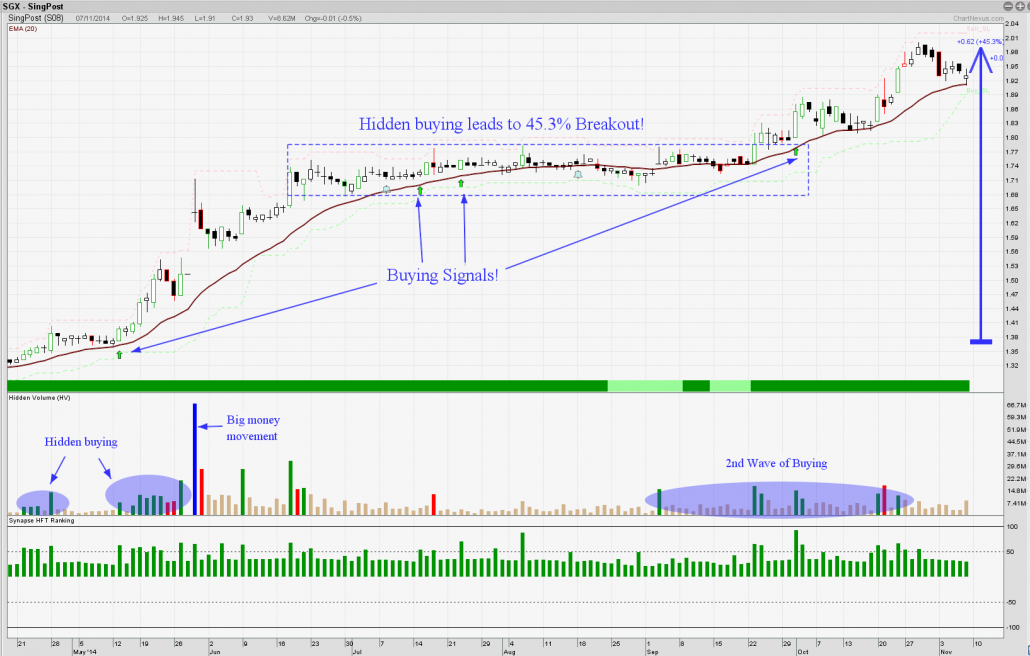
For new traders, learning how to read price and volume behaviour can be challenging, which is why our customised chart layout makes this a breeze, and allows you to read charts in 15 seconds or less.
Candlestick bars are colour-coded green/red to show whether the big buyers or big sellers are controlling the market, and these also highlight the best signal bars to pin-point your entries and exits for every trade.
Hidden Volume (HV) helps to flag out abnormal volume, helping you detect accumulation/distribution, breakouts/breakdowns, hidden buying/selling, and climatic buying/selling.
When used together, these tools give you an unparalleled advantage in the speed and accuracy of your chart analysis, by providing an edge that only professional traders have.
4) Risk Management
Plan your trade parameters (entry price, stoploss, profit target)




After finding a good trading opportunity, the next step is to know exactly when to get in and when to get out of a trade.
From the scanner, you can see the EP (Entry Price) which tells you what price you set your entry orders at, and the SL (Stoploss) which tells you what price to get out if a trade goes against you. Knowing these 2 critical pieces of data already puts you in the top 10% of traders.
Next, looking at the spreadsheet provided, it automatically helps you calculate your lot size, position-sizing, optimal risk per trade, and recommended TP (Profit Targets). In addition, it also continuously helps you evaluate your performance, by measuring your hitrate, R/R ratio, and average win vs. average loss. This is very valuable for you to fine-tune your trading style.
By combining the “Trade Setups” scan with these trade parameters, you can place your trades in 15 mins or less every day, and instantly transform into a Hands-free Trader!
5) Optimise Returns
Use advanced statistics to calculate Flux and increase probability
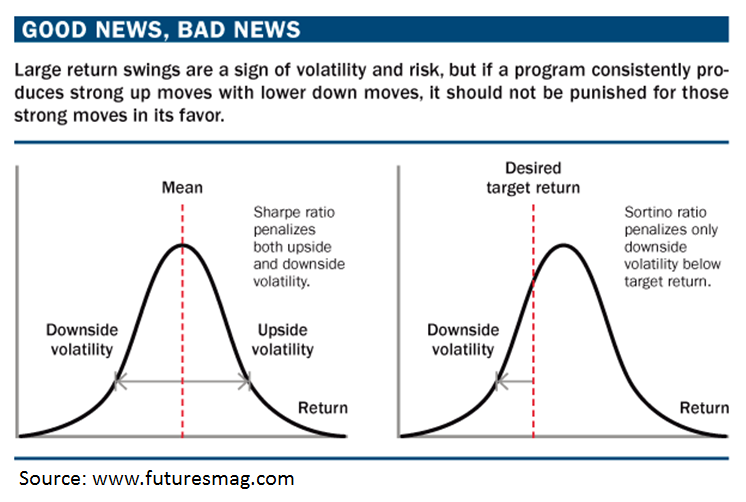
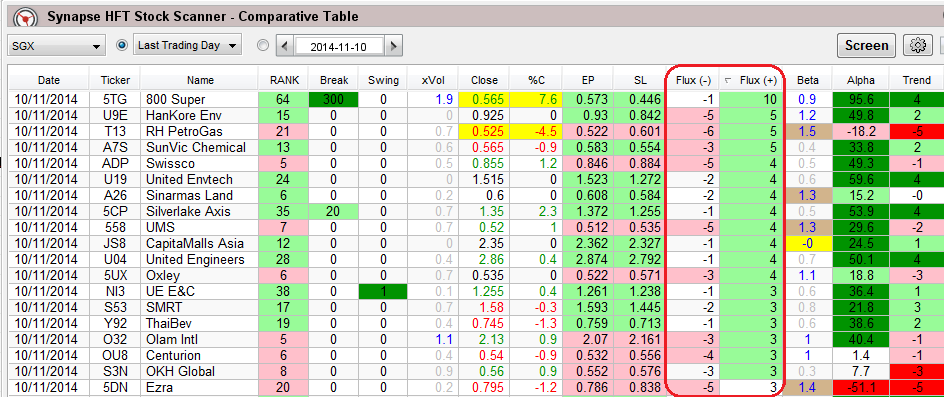
Many people assume that high volatility is bad, but here we have found a way to use it to increase our odds of higher returns, while keeping downside risk low.
By separating upside and downside volatility into Flux (+) & Flux (-), we are able to select counters with high upside fluctuation and low downside fluctuation, thus giving us higher returns with lower risk. Conversely, for shorting, we can look for counters with high downside fluctuation and low upside fluctuation.
This means that we can use this as an additional filter to further increase our probability of picking the best winning trades.
6) Trend-following
Perfect for long-term investors to spot turning points and catch big moves
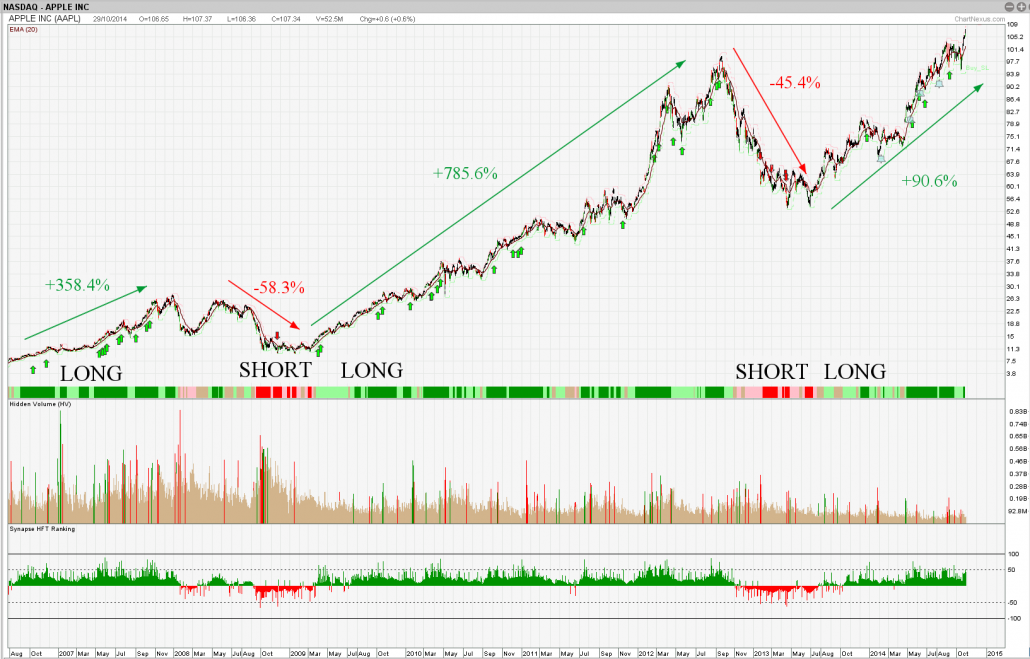
For long-term investors who are more interested in catching the big trends, the most important thing is to be able to identify the major turning points in the market.
By always staying on the right side of the trend, investors can ride the big moves, while avoiding large market corrections.
The coloured ribbon at the bottom of the main chart does just that, changing from red to green (bearish reversal into bear market), and from red to green (bullish reversal into bull market).
7) Portfolio Construction
Diversify away hidden risks with Alpha & Beta
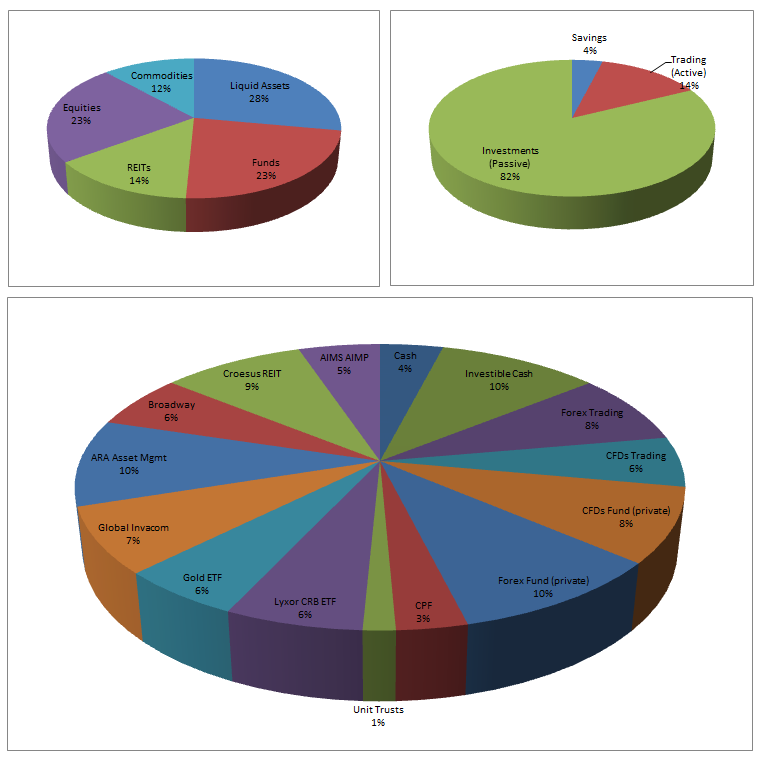
Ray Dalio, the founder of Bridgewater Associates (the biggest hedge fund in the world), created a unique formula to break down the components of a portfolio’s returns, so as to optimise the returns and diversify away unnecessary risk.
Returns = Cash + Beta + Alpha
By knowing the Beta & Alpha of every stock, you can better ensure that your portfolio has no hidden risk, and build a fully diversified portfolio that can do well in all market conditions.
Frequently Asked Questions (FAQs)
Where can I download the software?
The Synapse Stock Screener uses stock data feed from ChartNexus, hence it runs on the ChartNexus platform. To use the screener, you will first need to download the ChartNexus free software.
Download link: http://www.chartnexus.com.sg/software/cnx_software.php
If you have an existing account, your username/email and password remains the same.
If you do not have an existing account, your username is the email used for this software registration, and your default password is 12341234
For any issues regarding software installation or usage, feel free to contact them.
http://www.chartnexus.com.sg/support/contactus.php
How do I activate my subscription?
After registration and payment, please drop us an email with these details:
- Full Name
- VIP Member? Yes/No (All those who have registered/attended the Synapse Program are VIP Members)
- Mobile number
- Email address
- Facebook Profile URL (eg. For www.facebook.com/xxx, your profile is xxx)
Do note that your email address provided will be used to activate the subscription in ChartNexus. If you already have an existing ChartNexus account, please make sure the email you send us is the same email used to log into your ChartNexus account.
If you do not have an existing ChartNexus account, we will create a new one for you using your email address, and the default password is 12341234.
What is my login username and password?
If you have an existing account, your username/email and password remains the same.
If you do not have an existing account, your username is the email used for program/software registration, and your default password is 12341234.
I have downloaded the ChartNexus software, where can I find the subscription?
Click on the “Advanced” tab, you should see the Stock Screener icon.
If icon does not appear, click on “Help” > “Check for Upgrade” to upgrade to the latest version.
If that does not work, please check to make sure your ChartNexus login email is the same as the email you sent to us during the software registration, as that is the account we have activated.
If all else fails, please drop us an email. Thanks!
Where can I download the market data?
Click on “Start” > “System Settings” > “Data” > Check the relevant boxes > “Apply”
Do I need to download all the market data, or just SGX?
You can download data from up to 5 major markets.
We suggest that you download the data which is relevant to the market(s) that you are planning to trade.
Are the charts in real-time? How often do they update?
The charts are based on EOD (end-of-day) prices, which means they update at the end of the day.
The updates usually take place about 2-3 hours after the respective markets close.
Is there a quick guide to start using the screener/software?
Here is the video guide: https://synapsetrading.com/the-synapse-hft-stock-scanner/#guide
Here is another quick guide to start using the software, and what each of the columns mean:
- Before starting, check “Data Adjustments”.
- Start > System Settings > Price Adjustment Settings > Enable All > Save > Apply
- Make sure your ChartNexus sofware is running the latest version. Click on “Help” > “Check for Update”. If yours is not the latest version, your scanner will not yield the same results.
- Before clicking “Screen”, select market (SGX) and click the gear icon (next to the screen button) and input these parameters.
For all equity markets, the volume criteria is 500,000 for 50 days. For SGX, the minimum price filter is 0.50. For KLSE, the minimum price filter is 0.50. For HKSE, the minimum price filter is 5.0. For NYSE, the minimum price filter is 12. These are not definite rules, rather they are guidelines based on my personal preference. - After screening:
- RANK – Click this twice to sort (the best setups will end up at the top)
- Break – Number indicates new x-day high/low. Eg. -20 is new 20 day low, 100 is new 100 day high. Dark-coloured means there is a signal bar.
- Swing – This is either +1 (bullish swing setup) or -1 (bearish swing setup). Dark-coloured means there is a signal bar.
- xVol – This is the number of times above the average volume. Eg. 1.7 means today’s volume is 1.7x the usual volume. Those above average are in blue font, while those below average are in grey font. If the volume is unsually high, it will be highlighted in brown, and if it is climatic it will be highlighted in yellow.
- Close – closing price for the day.
- %C – percentage change in price for the day (compared to yesterday’s close)
For these 2 columns, if the %C is unusually large, it will be highlighted in yellow. - EP – price that will trigger and entry
- SL – recommend initial stoploss price
- Flux – The higher the positive flux (Flux +), the more upside volatility it has, meaning the more chance that it will surprise to the upside. The more negative the negative flux (Flux -), the more downside volatility it has, meaning the more chance that it will surprise to the downside.
- Alpha & Beta – http://www.cnbc.com/id/45777498
Can we sort the counters according to their rank, sector, etc?
For rank, you can double click the icon “rank” to sort it by rank. If it sorts from lowest to highest, press it again to sort it from highest to lowest. There is no sector classification, but you can create your own watchlists.
How do I create my own watchlists?
You can read this guide on ChartNexus: http://www.chartnexus.com.sg/learning/manual/cnx/sect0014.html
Where can I find the EMA indicator?
You can look under Moving Averages (MA), and click “edit” to find the “exponential” one. The default one I am using is the 20-EMA.
Will the Stock Screener continue to have updates/upgrades?
Yes, of course. We will continually improve the code and analysis as the market evolves.
