Recently, we have seen huge volatility and huge moves in the market, which have confused many traders and investors, so in this blog post, I am going to take a step back and look at some weekly charts to give an overview on the market direction for various markets, including stocks, forex, bonds, commodities, etc.
While the first wave of sell-offs were mostly panic-driven, the next wave of decline would likely be driven by fundamentals.
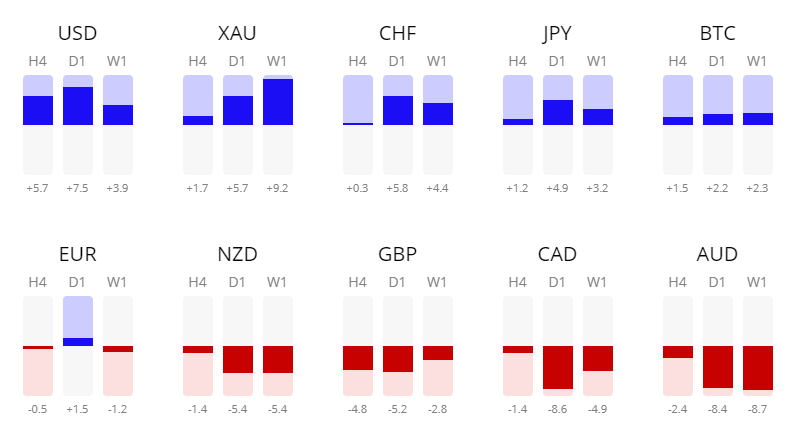
Looking at this strength meter, we can see that the safe haven assets like the USD, Gold, CHF and JPY have performed the best, while commodity-related currencies like the NZD, AUD and CAD have fared poorly.
Here’s a video on how you can use this knowledge in your trading:
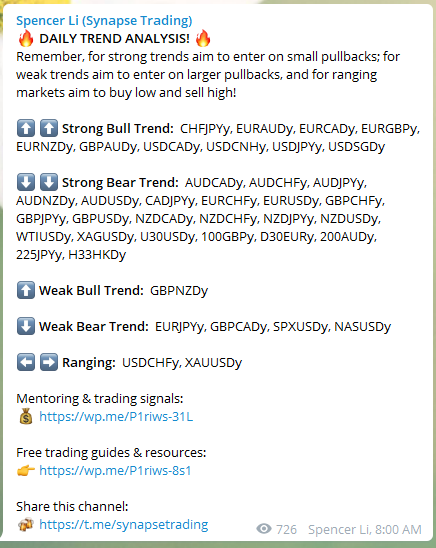
Daily Trend Analysis
To make things easier, you can also join our free Telegram channel to get a daily summary of trends and trading opportunities.
Click here to join: https://t.me/synapsetrading
US Dollar Index (DXY)
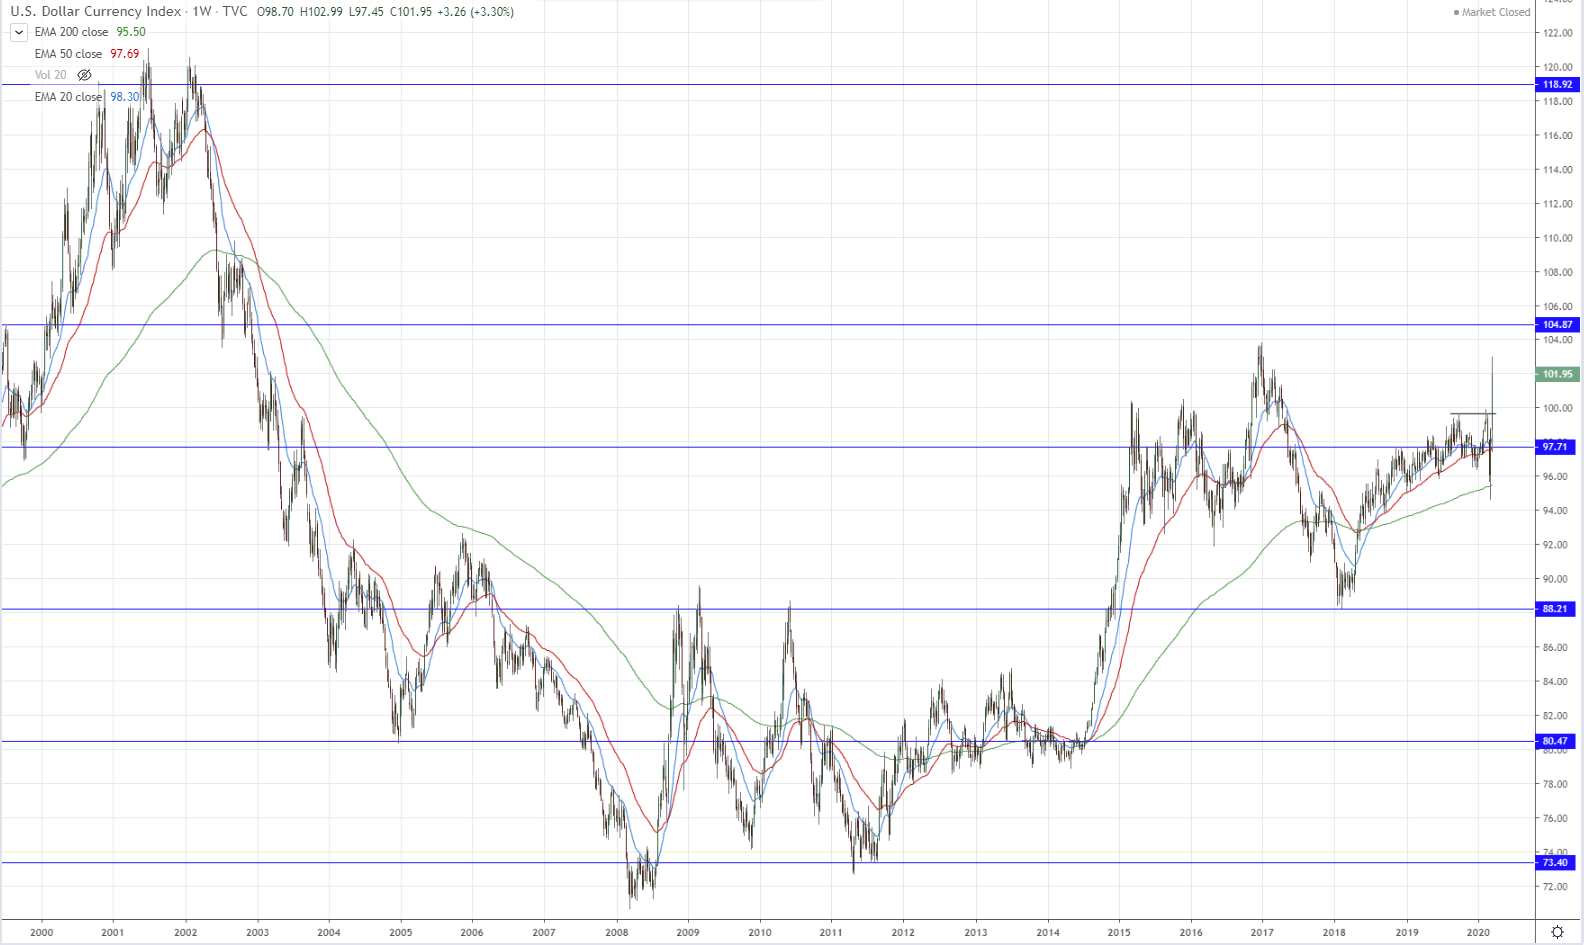
Despite the Fed cutting rates to zero, launching QE4, extending the repo program to $1.5 trillion, extending USD swaps to multiple central banks across the globe, and a potential $1-2 trillion fiscal package, actions which should technically weaken the USD have instead caused the USD to surge.
The reason for this is that about half of global trade is denominated in USD, and a lot of corporates and governments take up USD debt. When liquidity dries up, you will see people liquidating all other assets to buy USD, hence the tandem plunge in almost all assets, and rise of USD.
Looking at the chart, the USD has been on the rise since 2008, and as more businesses fold up, and liquidity dries up further, this could very possibly push the USD to new highs.
Thus, we can expect most currencies to be in decline relative to the USD, but to varying degrees.
Euro vs. US Dollar (EUR/USD)
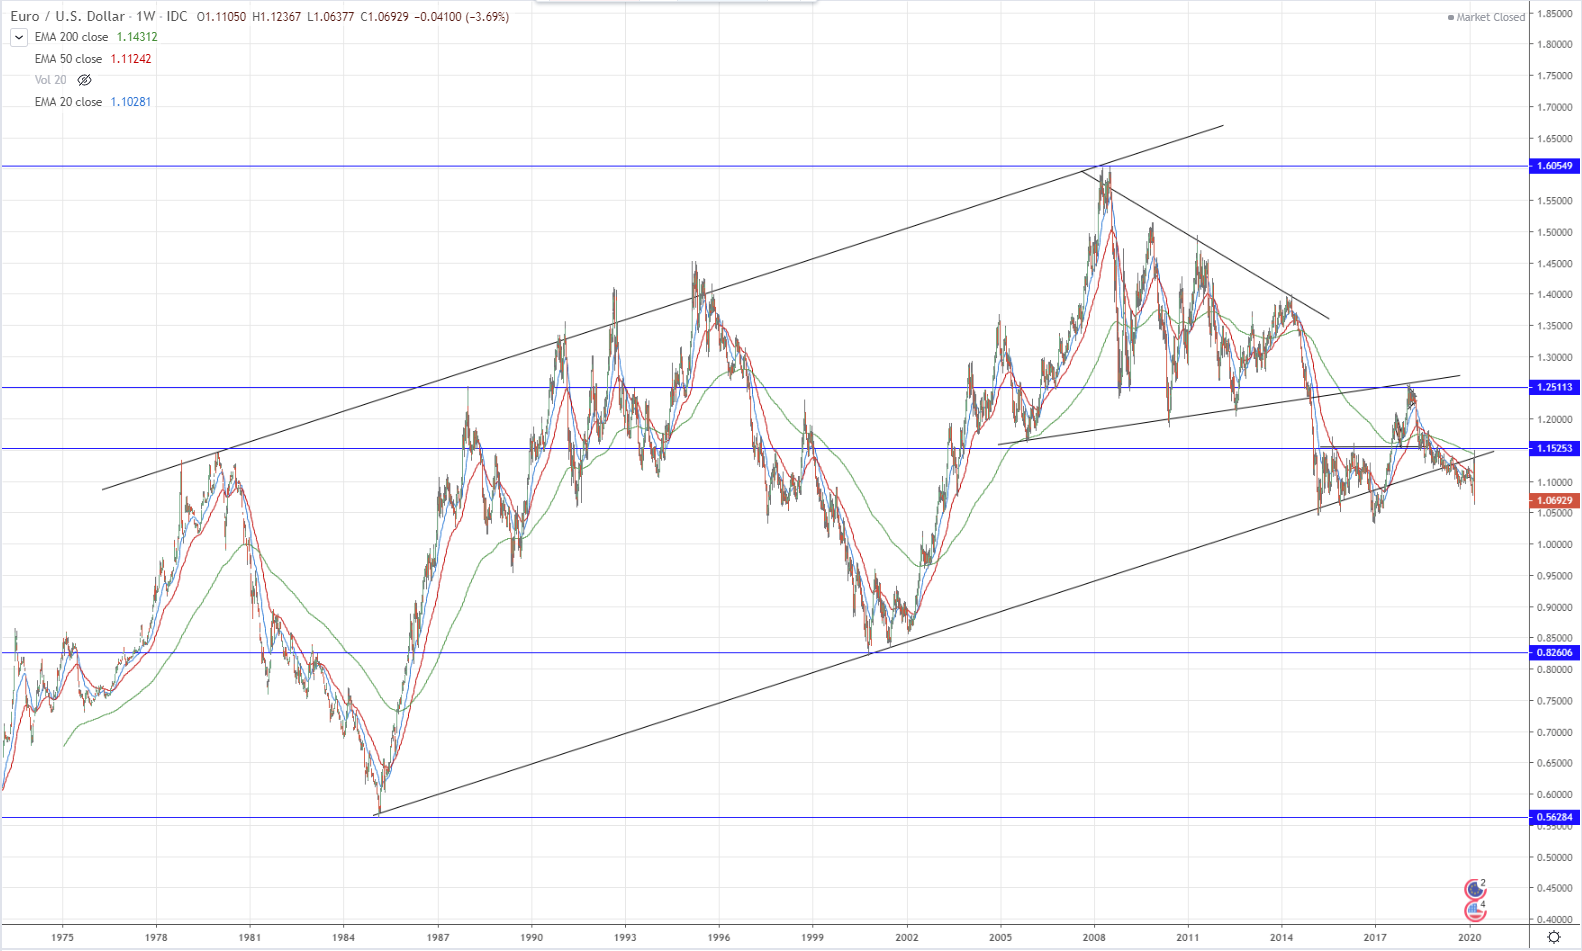

The EUR/USD has been in a large uptrend channel for more than 40 years, and now it is hovering at the lower edge of the channel.
If the trendline is unable to hold, we might see prices head down to test the 0.8250 levels.
Currently, Europe seems to be one of the worst-hit regions, and this could cause lasting damage to its economy.
British Pound vs. US Dollar (GBP/USD)
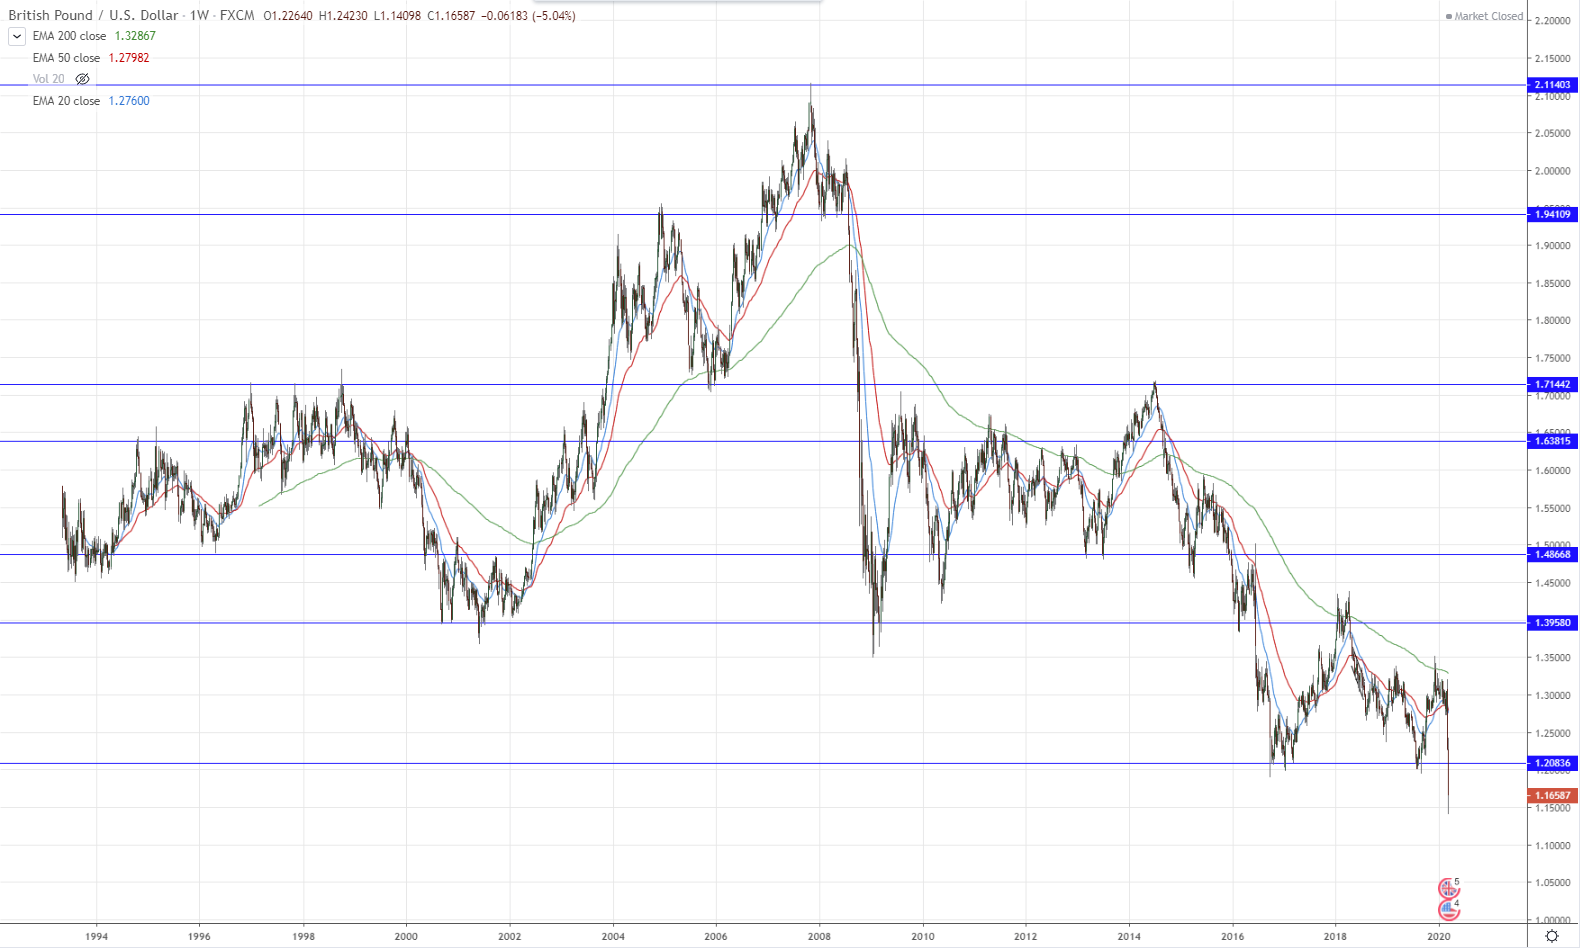

The GBP/USD is also showing great weakness, breaking to new lows. It has been on a downtrend since 2008.
In the medium-term, we can expect a test of the most recent support-turned-resistance level of 1.2084, and if that holds, we will likely see a continued slide of this pair.
Australian Dollar vs. US Dollar (AUD/USD)
The AUD is one of the weakest currencies in recent times, and after breaking below the lows of 2008, we could see the AUD/USD heading to the next support level at 0.4873.
In the medium-term, we are likely to see a test of the most recent support-turned-resistance level of 0.6113, before it continues lower.
NZ Dollar vs. US Dollar (NZD/USD)
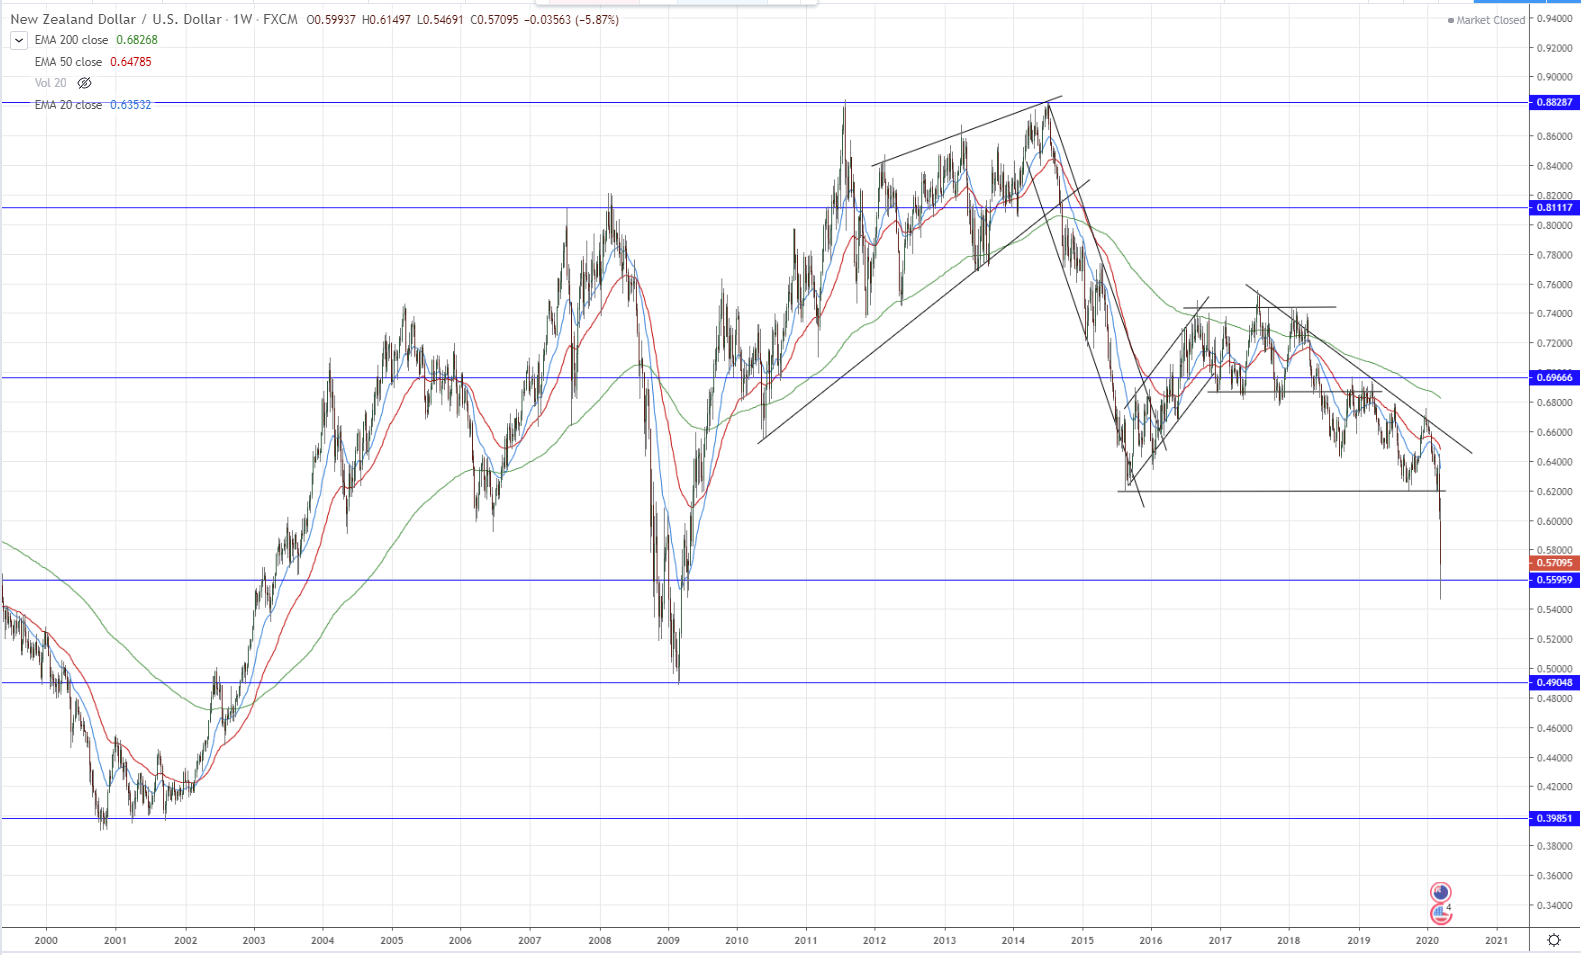

The NZD/USD is sightly less bearish than the AUD/USD, but it is also falling fast against the USD, and might be heading to test the next support 0.4905.
Currently, it has found some support at the 0.5596 level, so there might be some medium-term rebound or sideways movement.
US Dollar vs. Canadian Dollar (USD/CAD)


The USD/CAD has a huge pattern forming since 2008 that resembles a hybrid between a cup and handle pattern and a double bottom pattern.
Both are bullish patterns, which suggest that in the long-run this currency pair will continue to stay bullish.
In the medium-term, it has run into strong resistance and may take a while to break past that.
US Dollar vs. Swiss Franc (USD/CHF)
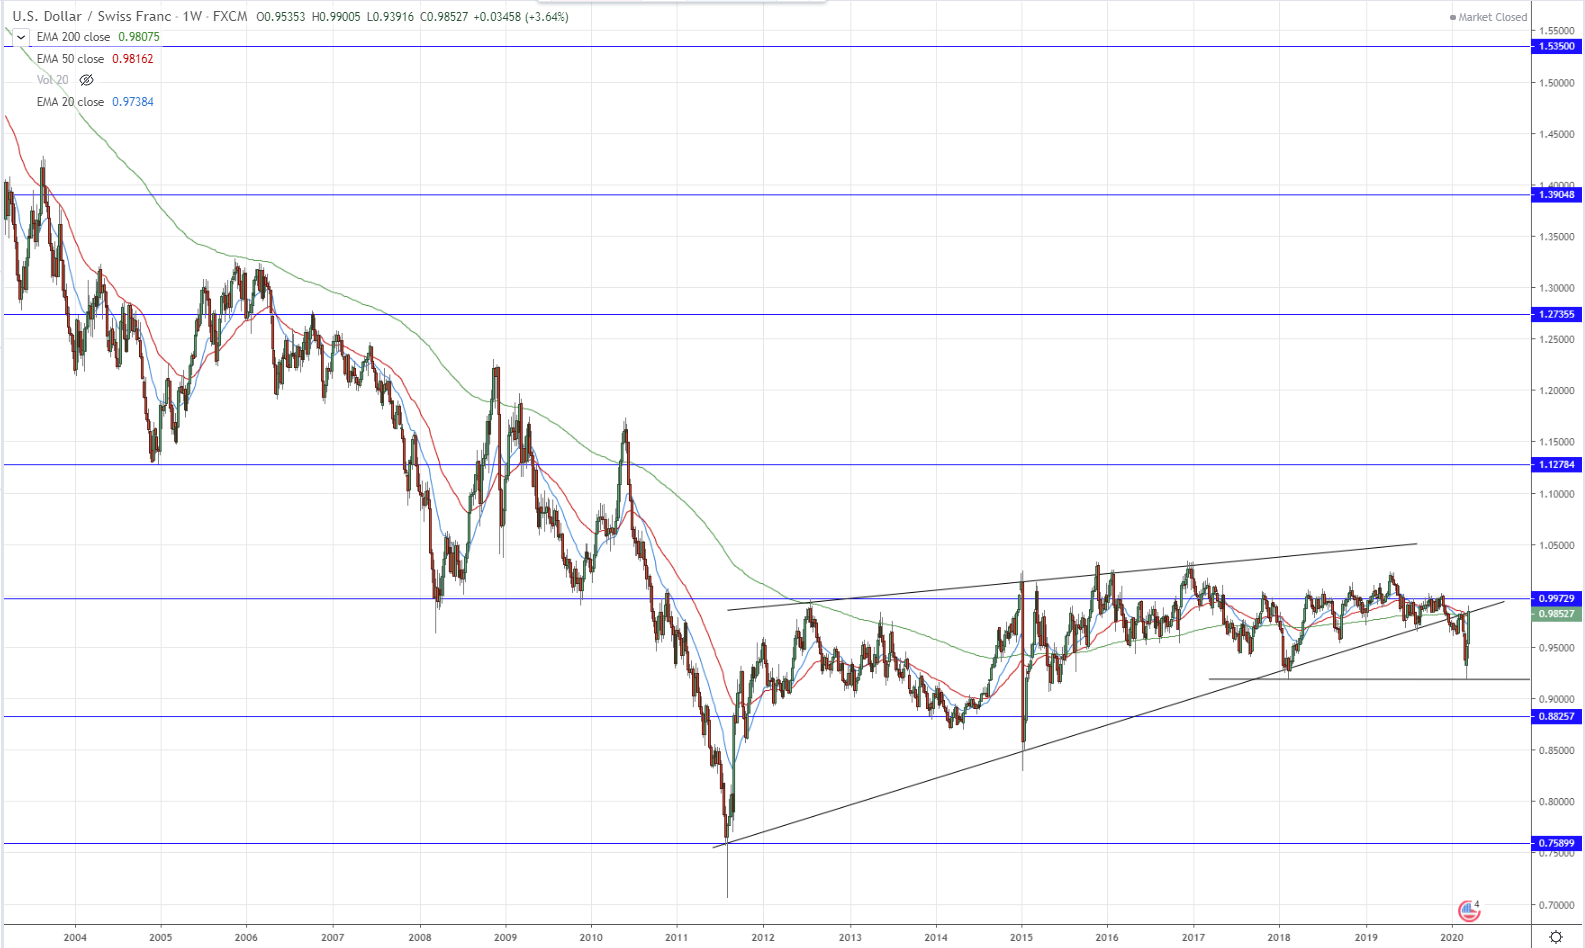

The USD/CHF has been on a long-term decline, and for the past 8 years or so, has been forming a giant rising wedge, which is a bearish price pattern.
The pattern had a breakout this year, but the USD has surged back to the covid crisis to test the breakout point.
I believe that in the long-term, the downtrend will continue, so I will be looking for good shorting opportunities once the USD demand starts to wane.
US Dollar vs. Japanese Yen (USD/JPY)
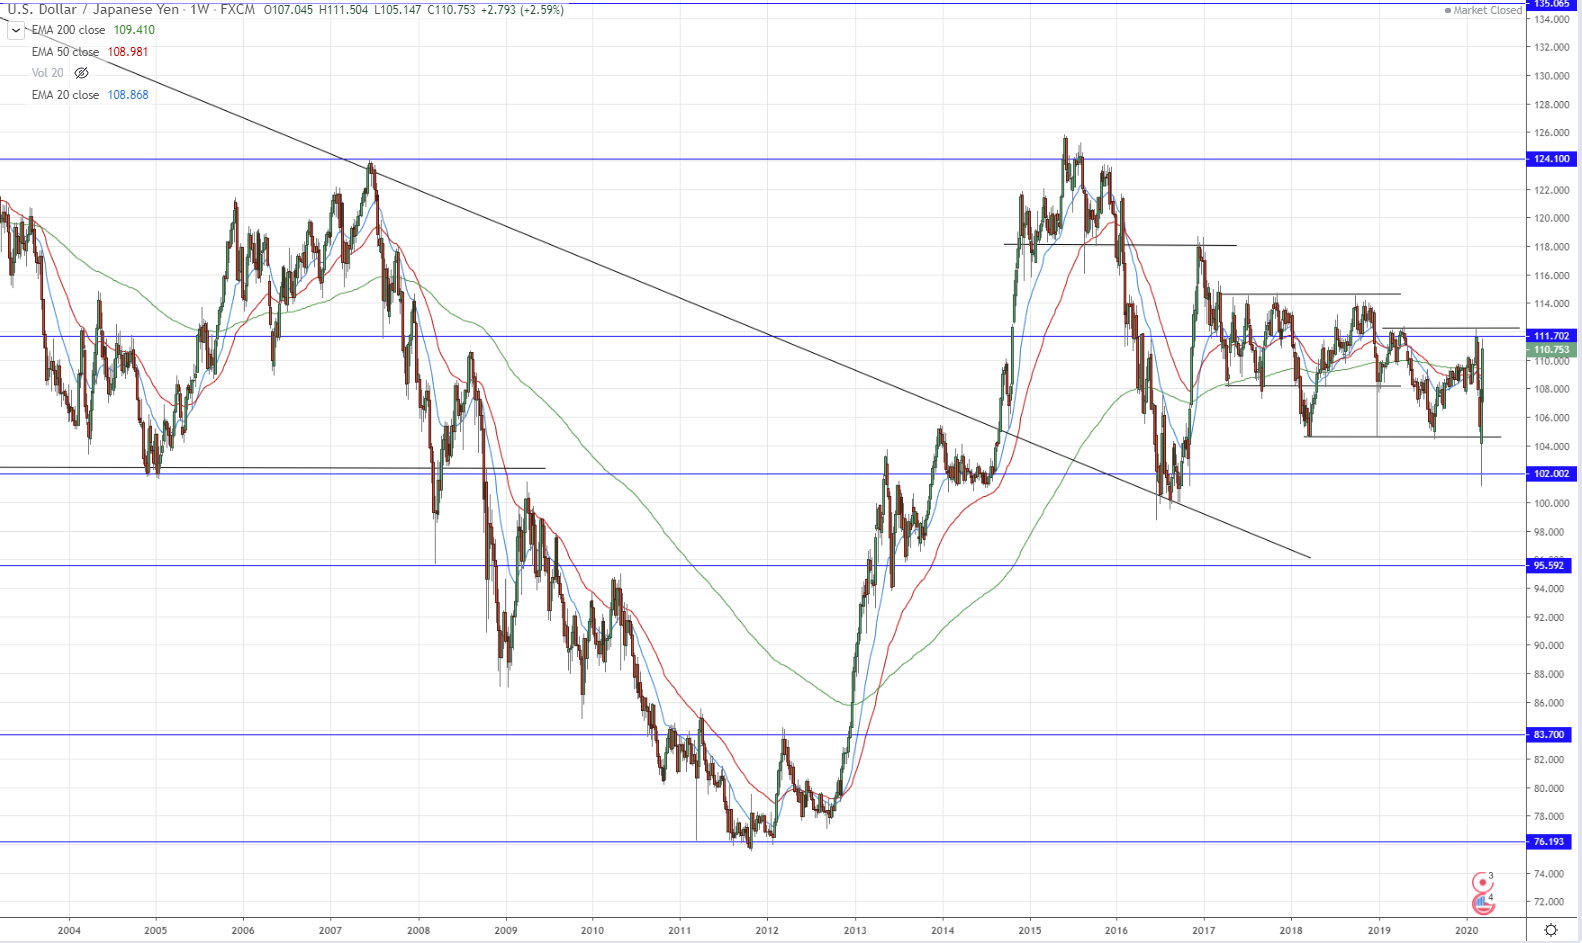

In 2014, the USD/JPY managed to break above the long-term bearish trend line, but instead of heading up, it went into a sideways movement for the next 5 years.
This pair is tricky to trade because it is rangebound at the moment, and both the bulls and bears are quite balanced.
In the long-run, we will need to see whether it breaks up or down from the consolidation pattern.
US Dollar vs. Singapore Dollar (USD/SGD)


Since the Singapore economy is very export-oriented, and perhaps because the SGD gets lumped in with other Asian currencies, it has seen much much weakening since the start of the crisis.
The USD/SGD has soared strongly to the resistance (prior swing high) of close to 1.46, and looks like it will be breaking that to test the next level at 1.5572.
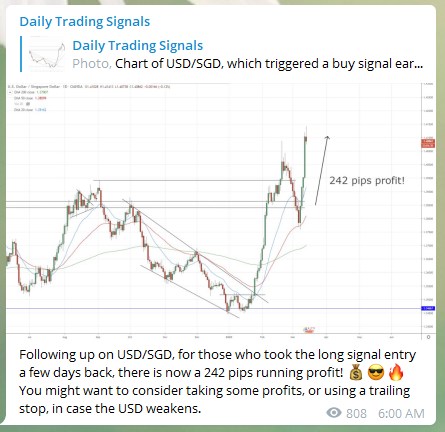

I have taken many swing trades to ride this strong trend, which has been very profitable for me and my students.
Since I live in Singapore (and use SGD currencies), but the bulk of my investments (and warchest) are in USD, I have actually seen a 8-10% ROI on my whole portfolio just due to the gain from the exchange rates.
S&P 500 Index (SPX)


The S&P 500 has corrected to around 30-35%, in the steepest drop ever on Wall Street, and it has broken past the previous swing low in 2018.
There is no doubt that it will continue to decline, and various analyst estimates have predicted targets ranging from 1800 (which is the 2016 swing low) to 2200.
This suggests a further decline of 10-30% from current price levels.
Since I have bought in near current levels using about 20-30% of my funds, my maximum portfolio drawdown is only 10%, which is pretty much offset by the forex gains (from the appreciating USD).
So for those wondering if they should liquidate their portfolio now, here is some useful advice:
I was expecting a short-medium-term rebound of sorts, before the next wave of selling kicks in.


We started accumulating longs near the low in anticipation of a rebound, but the rebound fizzled out, so we only manged to make a small gain on our positions.


Originally I was expecting a small rebound (correction in price) due to the extreme oversold conditions, but if the bearish sentiment is so strong, it might just drift sideways (correction in time) instead.
If the lows of the 3-bar range are taken out on Monday, then we can expect the downtrend to continue, if not we might see a correction (either in time or in price) play out.
Either way, we are looking for a good opportunity to short, but the precision in timing is important.
US Long-Term Treasury Bonds (TLT)
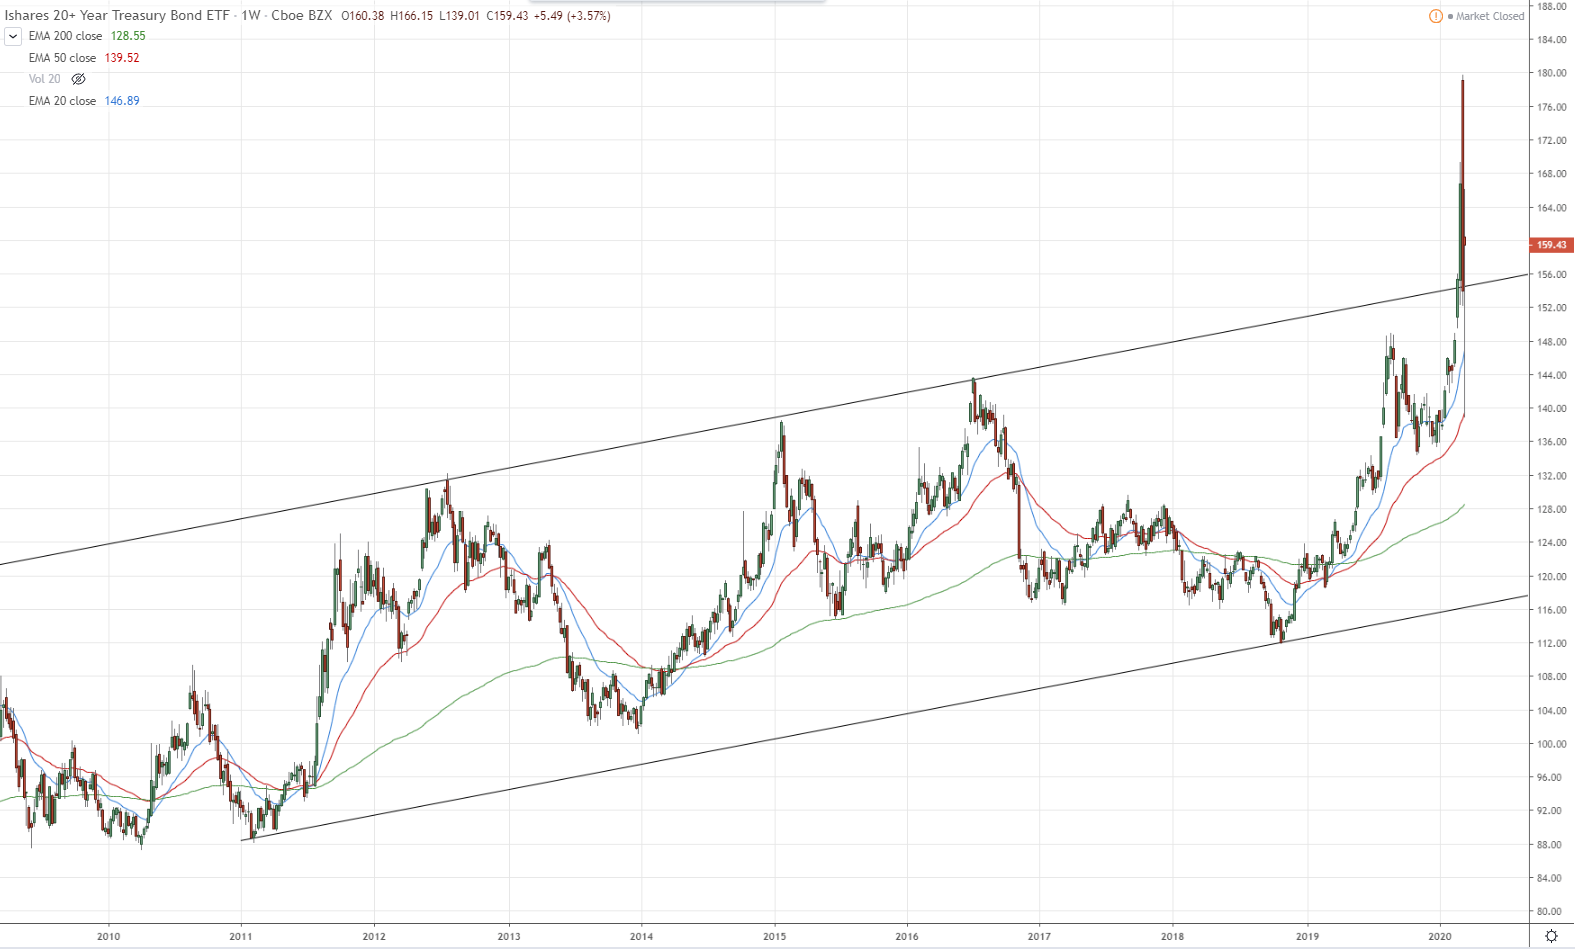

While bond prices usually spike when interest rates get cut, the TLT had a spike, but it was immediately followed by a plunge, perhaps due to liquidation of bonds for cash.
Technicals-wise, it has broken above a bullish trendline, which could suggest an acceleration of the uptrend in the long-run.
However, with interest rates already at zero, it is hard to see what other catalysts might push it upwards, and we might see short/medium-term cash outflow for liquidity, and long-term outflow into stocks once the market bottoms.
Gold (XAU/USD)
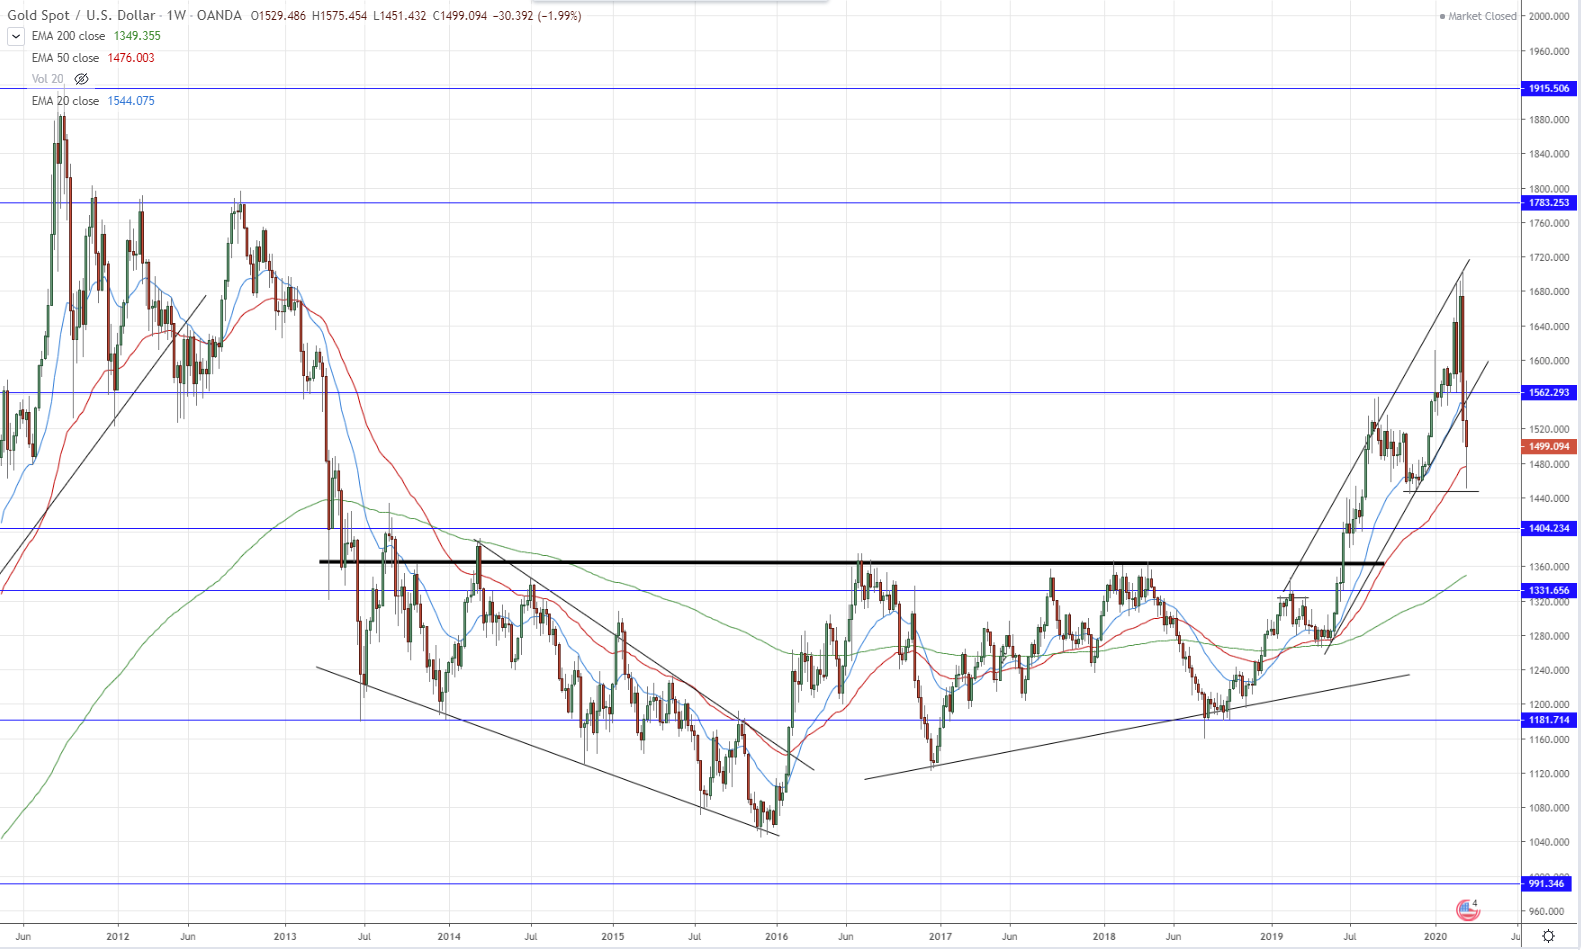

Typically, Gold is supposed to act as a hedge against market declines, by having an inverse-correlation with the stock market.
However, this time we saw a sell-down in Gold as well, probably due to liquidation for cash as well.
On the chart, from 2013 to 2019, we saw Gold carve out a sort of double bottom consolidation hybrid pattern, before breaking out and surging up.
While the price action does not look good in the short/medium-term, I think it still looks bullish in the long-term.
Crude Oil


Due to a confluence of price wars (increase in supply) and a sharp drop in demand, we have seen the price of Crude oil drop sharply to new lows.
The next major support level is at around $10, but we will probably see some intervention before that.
Want to Improve Your Trade Timing?
If you would like to get daily trading signals delivered right to your mobile device in real-time (so that you don’t miss any opportunities), and have a dedicated group of like-minded traders to make money consistently together, then you should definitely check out our training program & trading signals bundle:
https://synapsetrading.com/the-synapse-program/
Spencer is an avid globetrotter who achieved financial freedom in his 20s, while trading & teaching across 70+ countries. As a former professional trader in private equity and proprietary funds, he has over 15 years of market experience, and has been featured on more than 20 occasions in the media.


